Read the excerpt and analyze the document.
Climate and landforms shape where people farm, trade, and settle. Rivers and resources connect regions, but also create competition.
Figure 1.
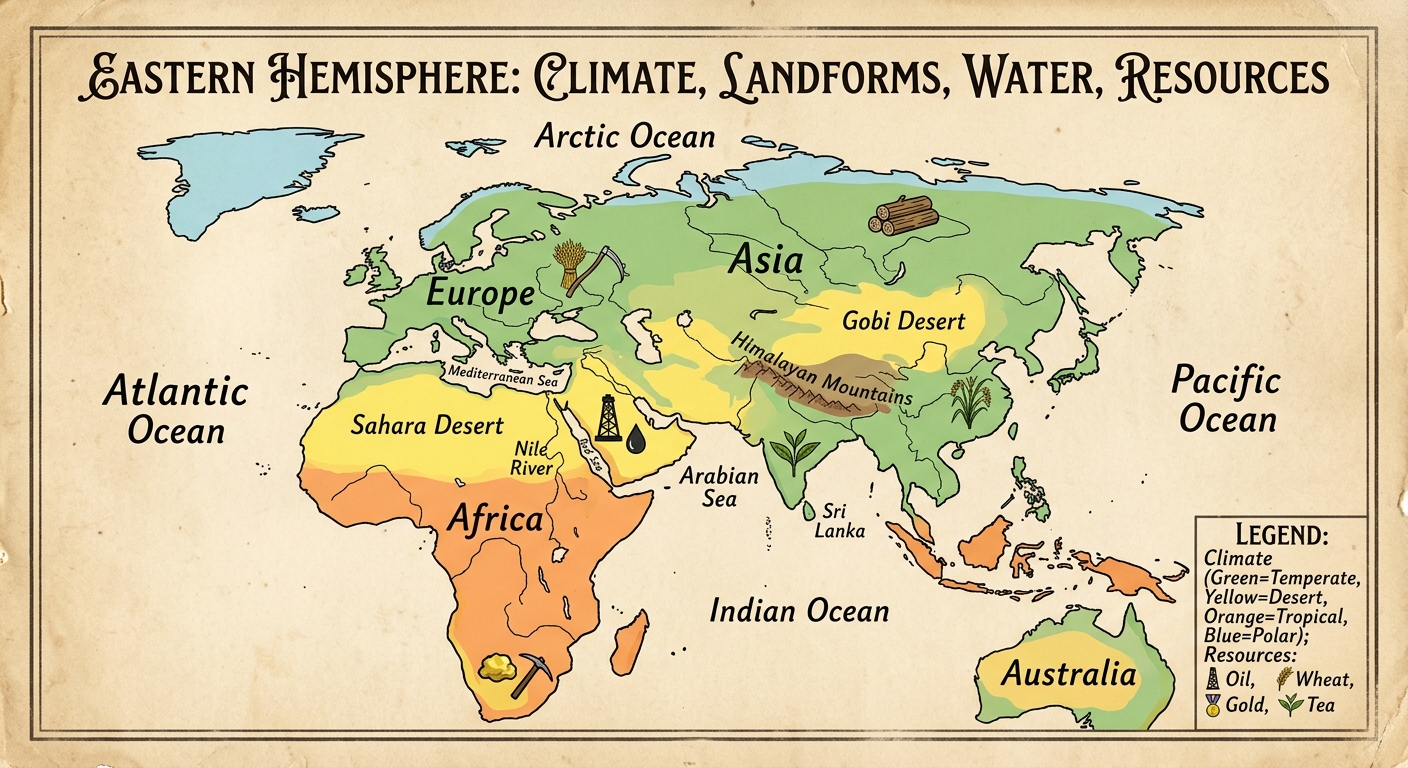
Use the historical document(s) and the short readings in the left panel to answer the associated questions.
Use the historical document(s) and the short readings in the left panel to answer the associated questions.
Read the excerpt and analyze the document.
Climate and landforms shape where people farm, trade, and settle. Rivers and resources connect regions, but also create competition.
Figure 1.
Which piece of evidence from the poster map best supports the idea that landforms can limit travel and connection between regions?
A student argues: “The map proves resources always lead to conflict.” Which response most accurately evaluates that claim using evidence?
Which claim is best supported by evidence from the excerpt and the poster map?
Using two specific pieces of evidence from the poster map (for example, a labeled landform/body of water, a climate zone, or a resource icon), explain how geography could shape economic activity in one Eastern Hemisphere region.
Use evidence from the excerpt and the poster map to explain one way geography can create cooperation or competition between regions. Cite at least one excerpt phrase and one map feature.
Geographers use maps to track how landforms, climate, and waterways shape human connections over time. The document shows major trade routes in 1200 CE, 1500 CE, and 1800 CE. Use the legend and timeline panels to answer the question.
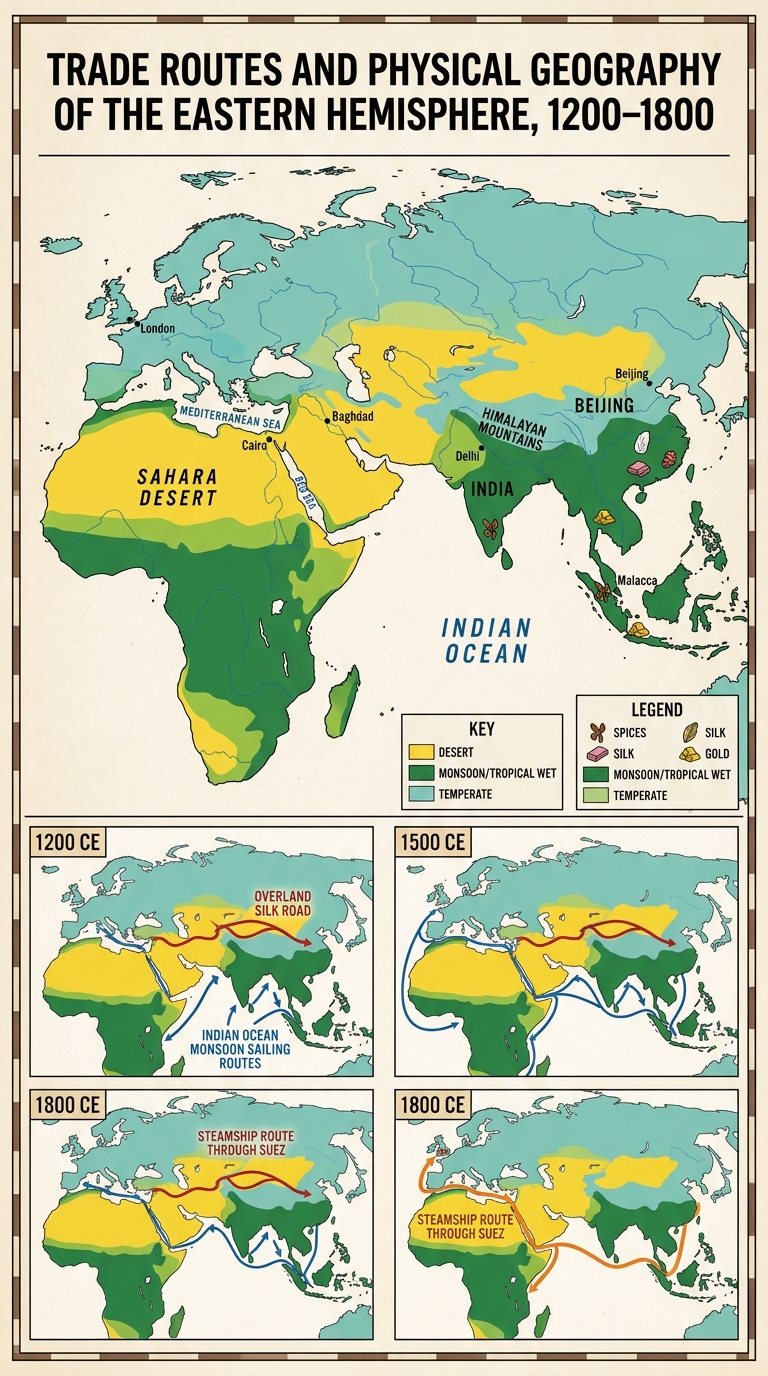
If a historian is looking for the clearest map evidence of increased Europe–South Asia sea connections, which time panel provides the best support?
Which claim is best supported by comparing the 1200 CE and 1500 CE timeline panels?
Describe one change over time shown in the trade routes (1200 CE → 1800 CE). Cite two specific map details: one physical environment feature (climate zone, landform, or body of water) and one route/connection feature. Explain how the physical environment relates to the change.
Evaluate the claim: “Even when technology and routes change, climate zones, landforms, and waterways continue to shape connections between regions.” Use evidence from at least two time panels and cite at least two map features.
Which map evidence best supports the idea that a landform limited overland travel routes in 1200 CE more than in later periods?
Maps can show climate zones, landforms, bodies of water, and resources. Compare the two regions on this document. Use the legend to identify deserts, monsoon areas, mountains, seas, and resource icons. Then explain how each region’s geography helps you interpret settlement and trade.
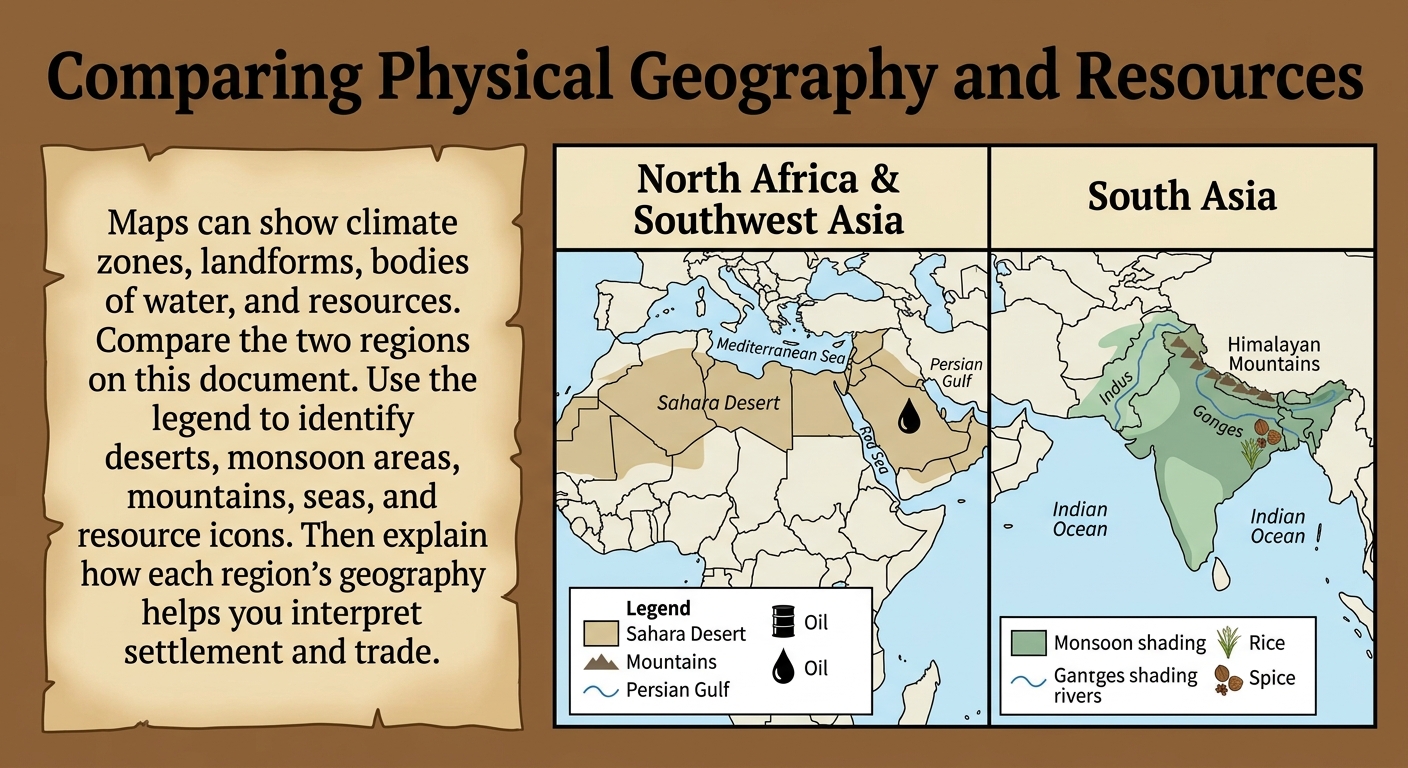
Which inference about economic activity is best contextualized by the map’s combination of climate zones, waterways, and resource icons?
Which comparison is best supported by the map’s climate and landform evidence?
Compare the two regions using two specific pieces of map evidence (one from each region). Explain how the differences could lead to different settlement patterns or economic activities. Be sure to cite the map features you use.
Use two map features to contextualize why certain historical trade routes developed in these regions. Explain how climate zones, landforms, or bodies of water could encourage or limit movement and exchange.
Which map evidence best supports the idea that bodies of water can connect regions through travel and trade?
Maps can show climate zones, landforms, bodies of water, and resources. Use the legend to identify deserts, monsoon regions, mountains, major rivers, and resource symbols. Then use those features to explain how geography can shape movement, trade, and settlement across regions.
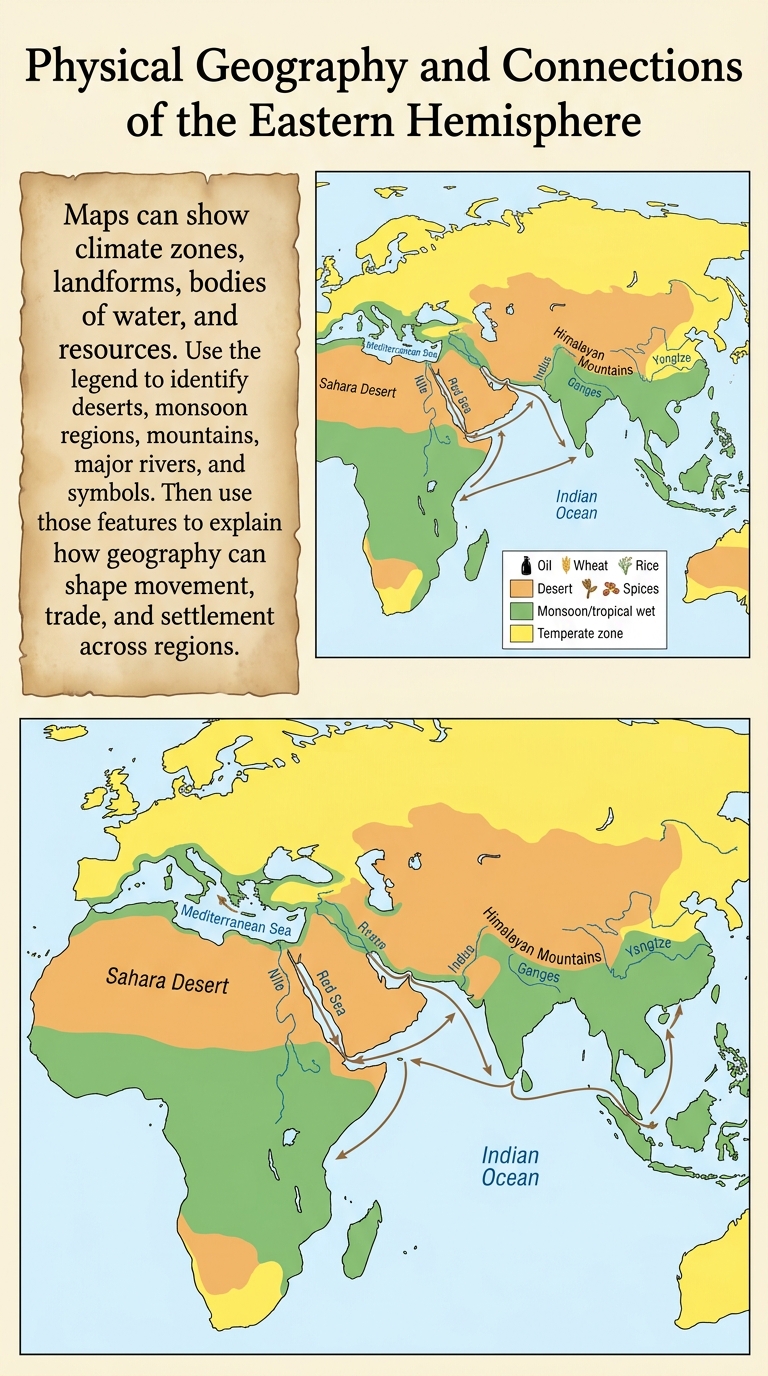
Which map evidence best supports the conclusion that bodies of water can connect regions through trade?
Which inference about settlement patterns is best supported by the map’s river and climate evidence?
Which map feature is the strongest evidence that a landform could limit overland movement between regions?
Choose one Eastern Hemisphere region shown on the map. Use two specific map features (a climate zone and either a landform or body of water) to explain how physical geography could influence movement or trade in that region.
Contextualize one resource icon on the map (oil, wheat, rice, or spices) by explaining how nearby physical features (climate, landform, river, or sea) could shape how that resource is produced or traded. Cite at least two map features.
Customs offices collected taxes (duties) on goods entering or leaving a port. These fees helped governments pay for services and sometimes protected local producers by making imported goods more expensive. Ports on major sea routes often became centers of trade and exchange.
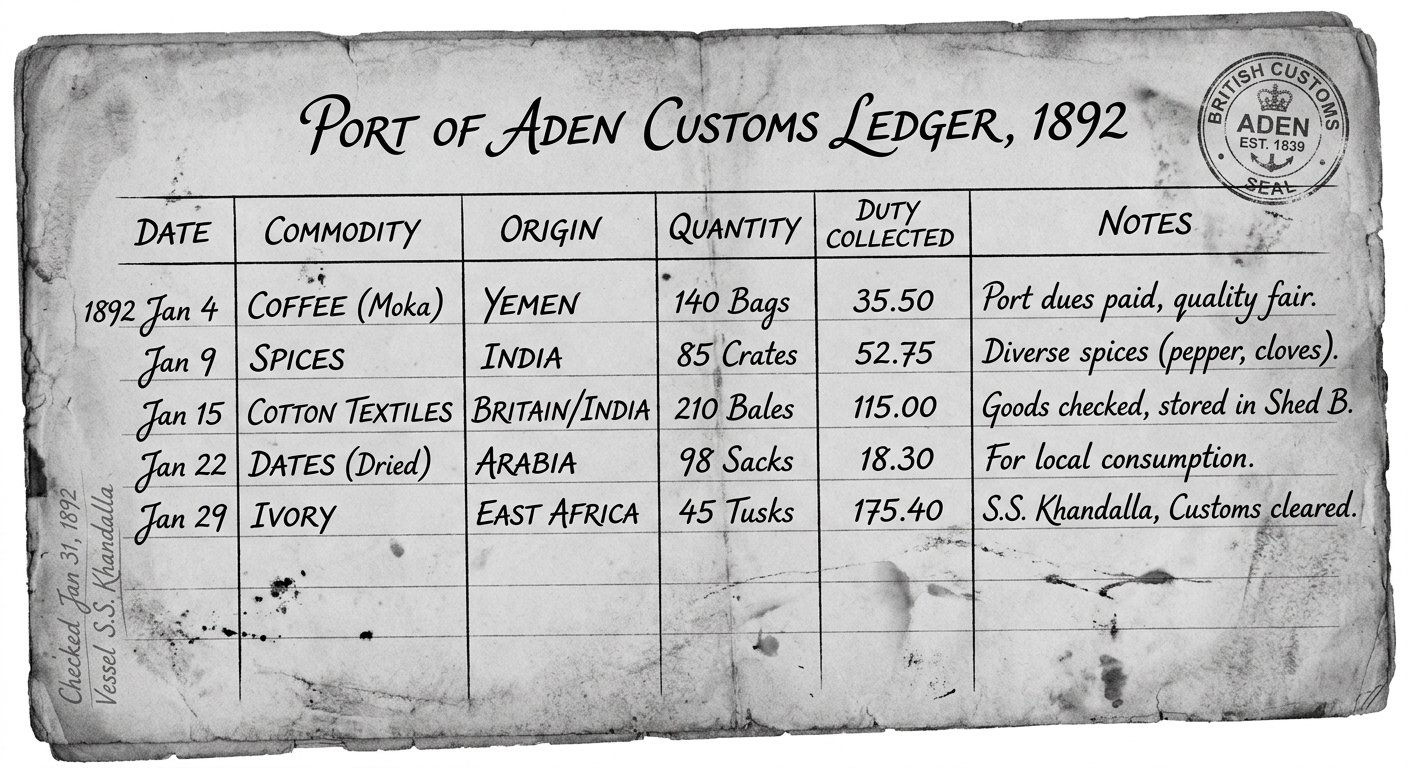
Based on the reading and the ledger, what is the main purpose of the “Duty Collected” amounts?
Which inference about economic connections is best supported by the ledger’s “Origin” entries?
A student claims: “Customs duties always make trade decrease.” Which response best evaluates this claim using the reading and the ledger?
Using evidence from the reading and two specific entries in the ledger (commodities and/or origins), explain one way customs duties could shape an economic system in a port city (for example, government revenue, trade specialization, or protection of local producers).
Choose one commodity listed in the ledger. Make an inference about how physical geography (a body of water, climate zone, or landform) could help explain why that commodity was traded through this port. Cite one map-type feature you would expect to see (for example, “coastal location on a sea route,” “near a monsoon sea route,” or “desert landform limiting overland travel”).