Copy of Analyzing and Interpreting Data (5/28/2026)
star
star
star
star
star
Last updated 3 months ago
7 Nsɛmmisa
Hyɛ no nsow a efi ɔkyerɛwfo no hɔ:
1
1
1
1
7
2
Goals:
Identify and interpret trends.
Identify and interpret relationships between variables.
Draw conclusions from data.
You will use the information in each image to help you solve the accompanying set of questions.
Examine each image closely, read everything, and examine each graph and data table.
Read each axis and data table headings.
Identify the independent and dependent variables (independent - typically changes first; dependent - changes in response to the independent variable).
Identify the variables used/plotted.
Check for scales/legends near graphs.
Look for patterns/trends in the data.
Find minimum and maximum values.
On line graphs - look for the slope (negative, positive, zero).
Draw conclusions from the relationships displayed between the variables.
Goals:
Identify and interpret trends.
Identify and interpret relationships between variables.
Draw conclusions from data.
You will use the information in each image to help you solve the accompanying set of questions.
Examine each image closely, read everything, and examine each graph and data table.
Read each axis and data table headings.
Identify the independent and dependent variables (independent - typically changes first; dependent - changes in response to the independent variable).
Identify the variables used/plotted.
Check for scales/legends near graphs.
Look for patterns/trends in the data.
Find minimum and maximum values.
On line graphs - look for the slope (negative, positive, zero).
Draw conclusions from the relationships displayed between the variables.
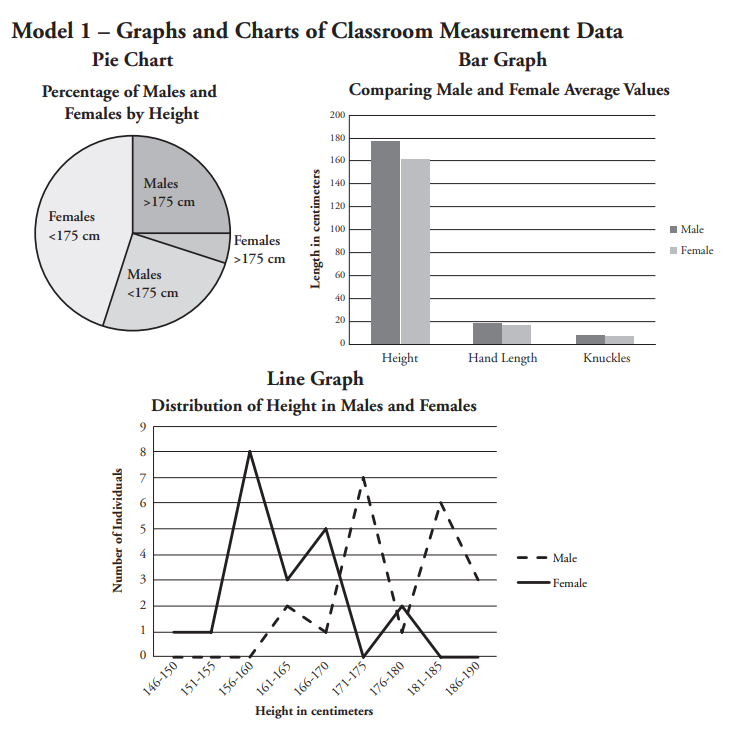
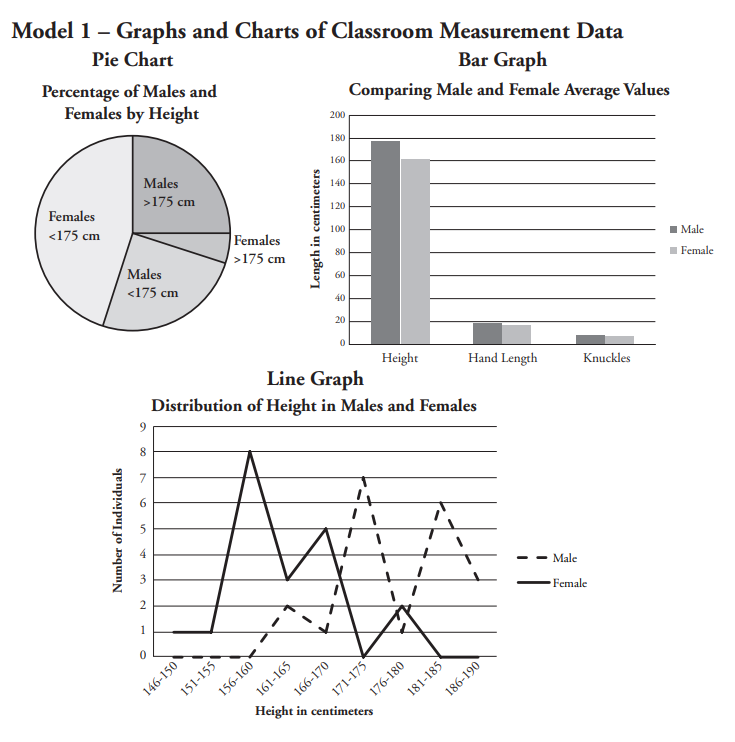
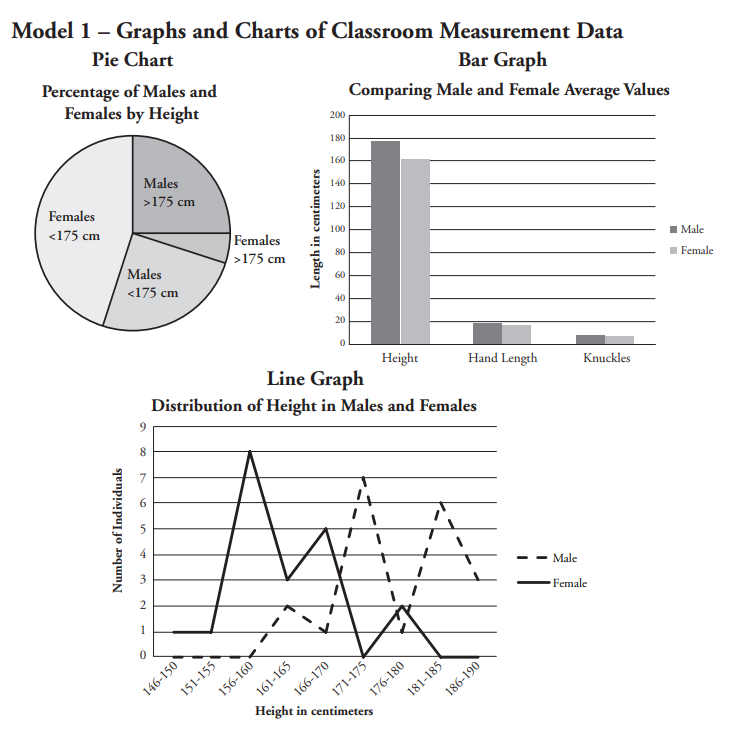
Refer to Model 1:
a. How many females fall within the range 146–155 cm tall?
b. How males are 181 cm or above in height?
c. Determine the approximate average height of males and of females.
d. How many males are taller than 175 cm?
e. What approximate percent of the total is your answer to question d?
f. Which graph(s)/chart(s) illustrate the answer to the previous question?
g. Which type of graph or chart in Model 1 shows a side-by-side comparison of data?
h. Which type of graph or chart in Model 1 shows trends in data across an entire data set?
Examine the relevant data in the line graphs and use the two spaces below to respond to the following - describe two trends (patterns) in males and females.
Height trend in males:
Height trend in females:
If you wanted to see if a correlation exists between the height of an individual and his/her hand length, what would be the best type of graph/chart to make?
Explain your reasoning to the prior question.
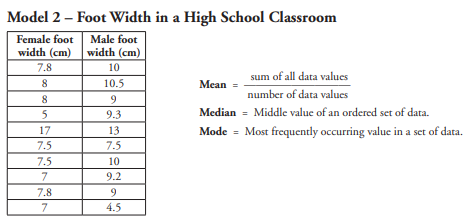
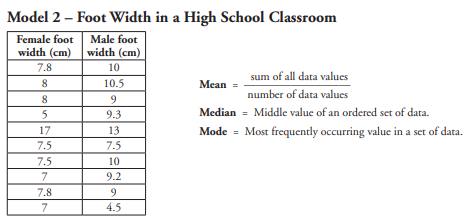
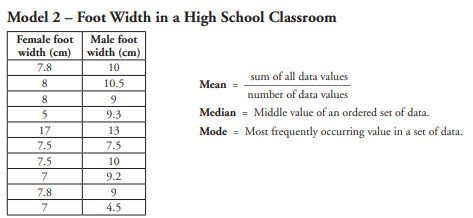
Refer to Model 2:
a. What values for foot width is most frequent in males?
b. What is the above value called?
c. Determine the median value for foot width for males.
d. Determine the median value for foot width for females.
e.
f. Determine the mean for the whole group of data.
g.
Within a data set, individual values may seem uncharacteristic or do not fit the general trend. These data points may be referred to as outliers or anomalous data. In most samples, a small number of outliers is expected due to the variation inherent in any naturally occurring population. Outliers can also result from measurement errors or data recording errors. Normal variation can often be distinguished from error by repeating the measurements to see if the same range is obtained. Scientists also use statistical calculations to determine the expected range of data, so that judgments can be made about the authenticity of individual data points. Outliers should not be ignored, however, as many interesting scientific discoveries have resulted from the study of such unexpected findings.
Which data point(s) in the foot width values in Model 2 might be considered outliers?
If there are no outliers, record "none" in the blank.
Male Foot Width:
Female Foot Width: