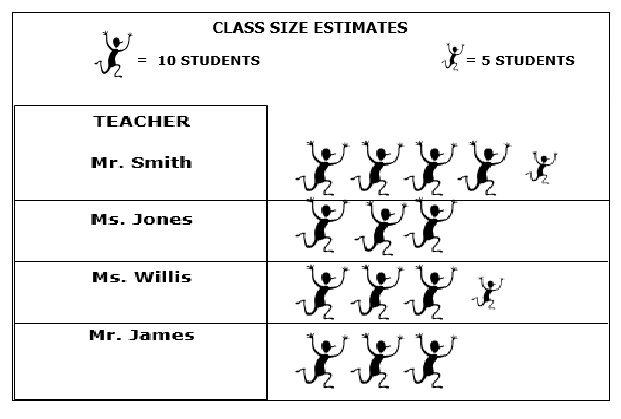
a.) The approximate size of Mr. Smith's class:
b.) The approximate size of Ms. Jones's class:
a.) How many more students are in Mr. Smith's class than Ms. Jones?
b.) The total number of students in Ms. Jones's and Ms. Willis's classes?
c.) Total number of students at this high school?
a.) Record the math you must perform to determine the answer to #2a.
b.) Record the math you must perform to determine the answer to #2b.
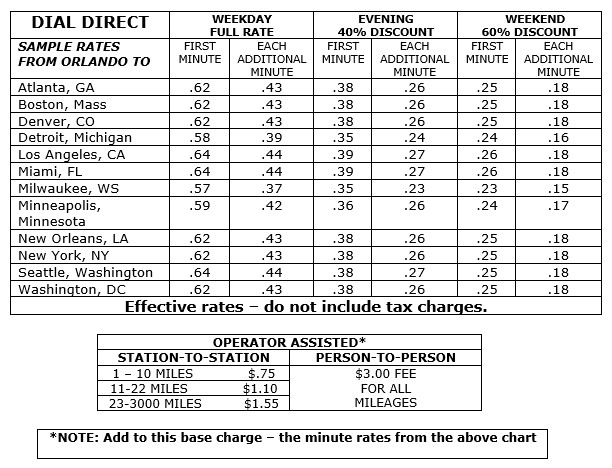
a.) What would be the price of a 7 minute direct dial call to New York, NY if a call was made on a Tuesday evening?
b.) Record the math that you had to do to answer #4a?
a.) What is the difference in cost of a 7 minute dial direct call to New York, NY and a 7 minute person-to-person call to New York, NY?
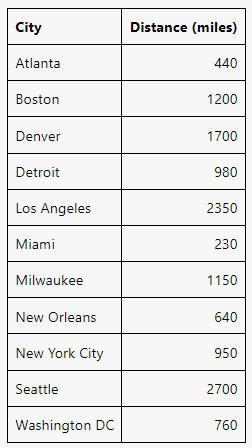
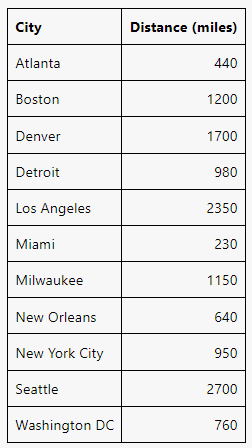
b.) What is the price of a 12 minute operator assisted station-to-station call to Miami, FL on a Tuesday at noon (below is a table that displays the distance that Orlando, FL is from each city in miles)?
c.) What is the difference in price for a 9 minute dial direct call to Los Angeles, CA at 10:00 AM and the same call made at 10:00 PM?
a.) What is the cost of an 18 minute operator-assisted, station-to-station call at 10:30 PM to New Orleans?
b.) If a 3% tax is applied to the total of any call, what would be the total cost of a 12 minute weekday, dial direct call to Detroit?
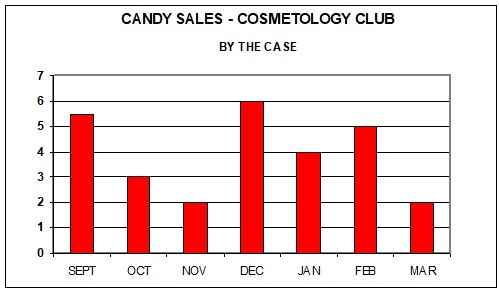
What does the y-axis on the above bar graph represent?
a.) What two months had approximately the same amount of candy sold?
b.) The amount of candy sold in December is twice the amount of candy sold in which other month?
c.) What was the total amount of candy sold during the school year in the bar graph?
d.) Which month showed a 100% increase in sales over the month of November?
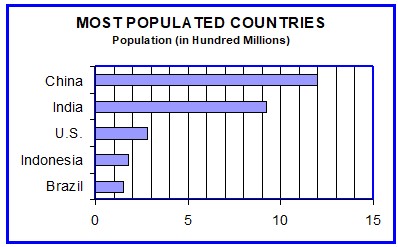
a.) Which two countries have the closest population?
b.) Approximately how many more people living in China versus India?
c.) Based upon the provided information, can we tell how the populations of each country will grow or change over time?
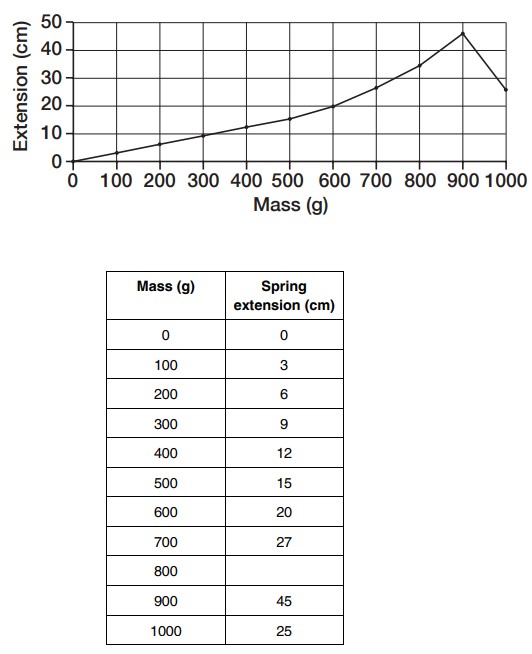
a.) What kind of graph is displayed above?
b.) What value in the y-axis of the line graph is missing from the data table?
What likely happened to the spring when the mass of 1000 g was hung upon it?