Copy of Graphical Interpretation (March 2024) (5/28/2026)
star
star
star
star
star
Last updated about 2 hours ago
4 questions
4
1
4
6
Learning Goals:
I can construct appropriate graphs (bar, pie, scatterplot, line graph) to communicate different types of scientific data clearly and effectively.
I can analyze and interpret data displayed visually in charts, diagrams, and graphs in order to draw conclusions and make evidence-based evaluations.
I can identify independent and dependent variables, recognize trends/patterns in data sets, and understand how to display relationships between quantities using graphs.
Question 1
1.
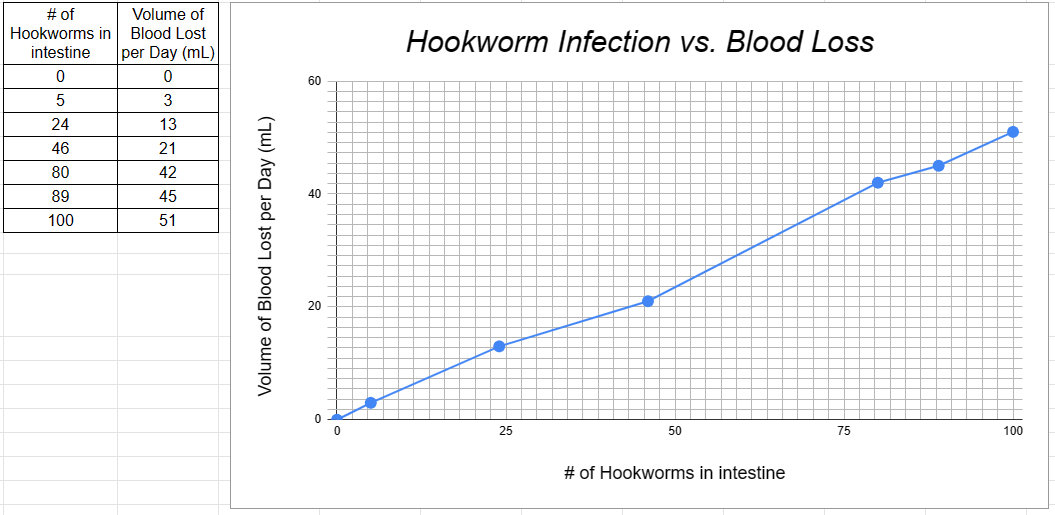
Refer to the above line graph and data table:
a. What is the independent variable from the above data? _______
b. What is the dependent variable? _______
c. If a person has 50 hookworms in their intestines, how much blood would they lose in one day? _______
d. How much blood would be lost by a person containing 10 hookworms in a week? _______
Question 2
2.
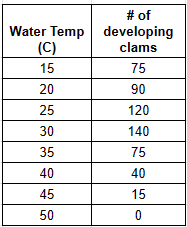
What type of graph would you use to display the following data? _______
Question 3
3.
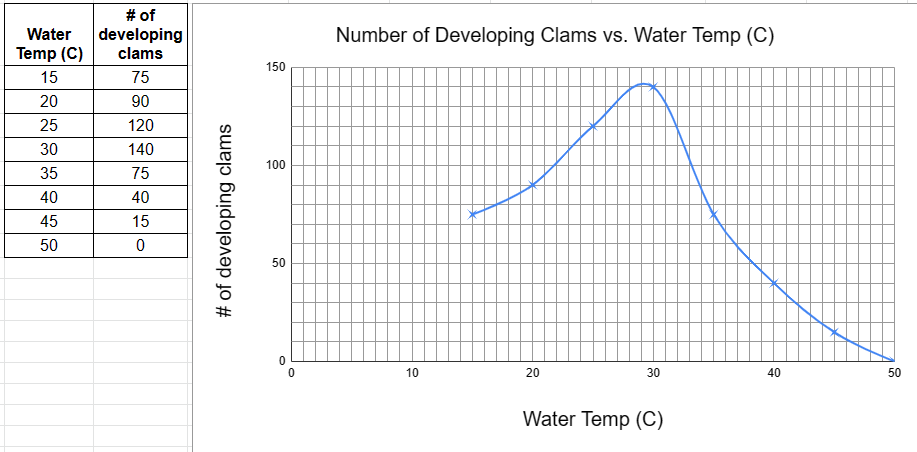
Refer to the above data table and line graph:
a. What is the independent variable? _______
b. What is the dependent variable? _______
c. What is the optimal temperature for clam development? _______
d. Finish this conclusion from the data: "As the temperature increases past 31 degrees Celsius, the number of developing clams _______.
Question 4
4.
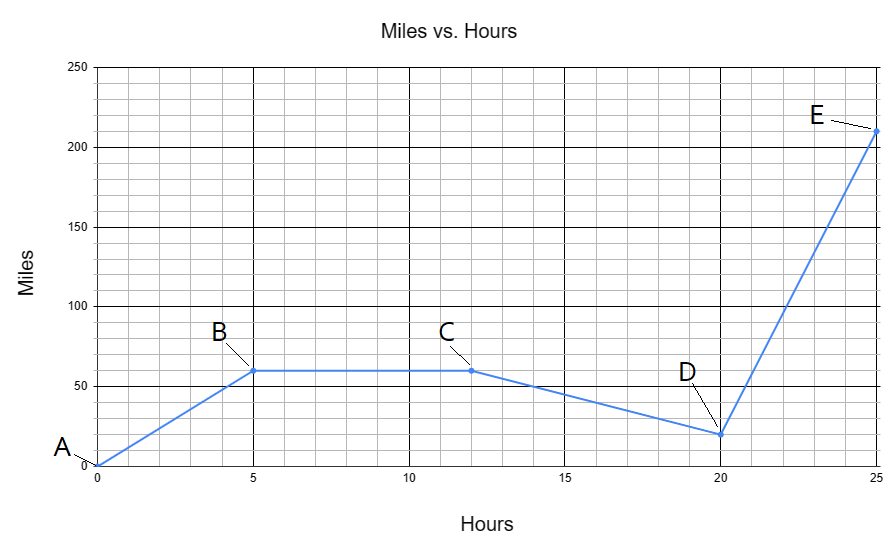
Refer to the above line graph:
a. How many total miles did the car travel? _______
b. What was the average speed (miles/hour) of the car for the entire trip? _______
c. Describe the motion of the car represented by segment BC. _______
d. What direction of the car is represented by segment CD? _______
e. How many miles were traveled in the first two hours of the trip? _______
f. Which segment represents the car traveling the fastest? _______