Přejít k hlavnímu obsahu
Přihlásit se
Sign up for FREE
arrow_back
Knihovna

Copy of 2.) Simulation - Waves on a String (5/28/2026)

star
star
star
star
star
Poslední aktualizace about 1 month ago
14 Dotazy
Vocabulary
1
1
1
1
1
1
Simulation
1
5
1

Use the following links to define:

  • Amplitude - https://flexbooks.ck12.org/cbook/ck-12-middle-school-physical-science-flexbook-2.0/section/16.5/primary/lesson/wave-amplitude-ms-ps/

  • Transverse Wave - same link as above

  • Longitudinal Wave - same link as above

  • Wavelength - https://flexbooks.ck12.org/cbook/ck-12-middle-school-physical-science-flexbook-2.0/section/16.6/primary/lesson/wavelength-ms-ps/

  • Frequency - https://flexbooks.ck12.org/cbook/ck-12-middle-school-physical-science-flexbook-2.0/section/16.7/primary/lesson/wave-frequency-ms-ps/

  • Wave Speed - https://flexbooks.ck12.org/cbook/ck-12-middle-school-physical-science-flexbook-2.0/section/16.8/primary/lesson/wave-speed-ms-ps/

Place your definitions below.

  • Warning, if your definitions do not align with the information presented in the links, you will not receive any points for your answers.

Otázka 1
1.

Amplitude

Otázka 2
2.

Transverse Wave

Otázka 3
3.

Longitudinal Wave

Otázka 4
4.

Wavelength

Otázka 5
5.

Frequency

Otázka 6
6.

Wave Speed

In the simulation below:

  • Turn on Oscillate.

  • Click, "No End".

  • Set the speed to "slow".

These three settings need to remain in each of the instructions below the simulation.

2
Otázka 7a
7a.

Without changing frequency, damping, and tension, increase and decrease the amplitude setting.

Describe what happens to the wave crest as you increase the amplitude setting.

Also describe what happens to the wave crest when you decrease amplitude.

2
Otázka 7b
7b.

Return the amplitude to 0.75 cm, do not alter the damping or the tension.

Describe what happens to the wave as you increase the frequency setting to 3.00 Hz.

Also describe what happens when you decrease this setting from 1.50 Hz to 0.75 Hz.

5
Otázka 8a
8a.

  1. Set amplitude to its highest setting.

  2. Set frequency to 0.25 Hz.

  3. Set damping and tension to their lowest setting:

  4. Ensure that oscillate and no end are selected and click "play".

  5. Pause the simulation when the oscillating arm (the metal arm on the left) is at its highest point - make sure that at least two waves are visible.

  6. Take a screenshot of the wave, click "Show your work," and paste the screenshot there.

While the simulation is still paused, click the "rulers" in the bottom-right.

  • Use the vertical ruler to measure the amplitude.

    • Using straight lines, or double-sided arrows, and labels - identify the amplitude (and it's measurement).

  • Use the horizontal ruler to measure the wavelength from one crest to the next crest.

    • Using straight lines, or double-sided arrows, and labels - identify the wavelength (and it's measurement) on the screenshot.

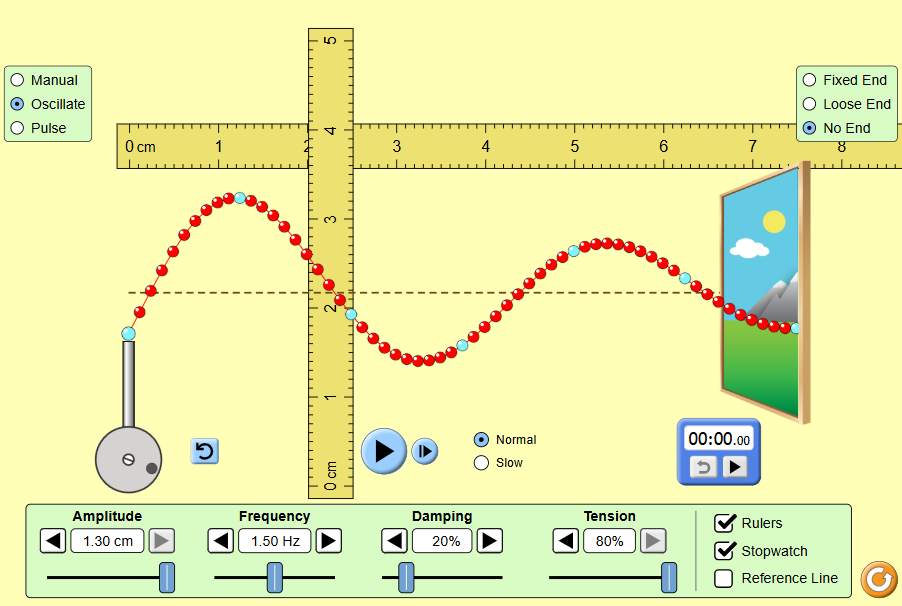
In the simulation below, do the following (your simulation should resemble the below image):

  1. Select "Oscillate"

  2. Select "No End"

  3. Select "Rulers"

  4. Select "Stopwatch"

  5. Select "Normal"

  6. Amplitude 1.30 cm

  7. Frequency 1.50 Hz

  8. Damping 20%

  9. Tension 80%

  10. Place the horizontal ruler so the 0 cm mark is lined-up with the arm of the oscillator (it moves up and down).

  11. Place the vertical ruler 2 cm to the right of the oscillator.

If you have done everything correct, your simulation will resemble the above image (the wave may look a little different, though).

6
Otázka 9a
9a.

I must grade this section.

After you have set-up the simulation, above, using the instructions posted above the simulation (there is an image to assist you, above)...

You will be counting the number of wave crests that pass by the vertical ruler in a 5 second period of time.

  1. Click the start arrow on the timer (it will sync with the Play/Pause button that controls the simulation).

  2. Click "Play" to start the simulation.

  3. Count the wave crests that pass near the left-side of the vertical ruler in a 5 second period of time.

  4. Repeat this five times.

  5. Record the data (wave crests and time in seconds) in the data table, below.

  6. After all data is collected, calculate the mean number of wave crests and time in seconds - record your mean time to the nearest hundredth and mean wave crests to the nearest 10th.

To reset the timer click the curved arrow button on the timer.

Time (sec)

Wave Crests

Mean Time

(sec)

Mean

Wave Crests

What wave property (other than wave crests) did you just measure?
1
Otázka 10a
10a.

In the above simulation, investigate how wave behavior is similar and different when the string is on a fixed and loose end point.

Don't be afraid to manipulate the settings.

Describe what you observe below.

Otázka 11
11.

Look back to your definitions in part 1.

What kind of wave did we observe in this simulation?

What kind of wave did we not observe in this simulation?

Otázka 12
12.

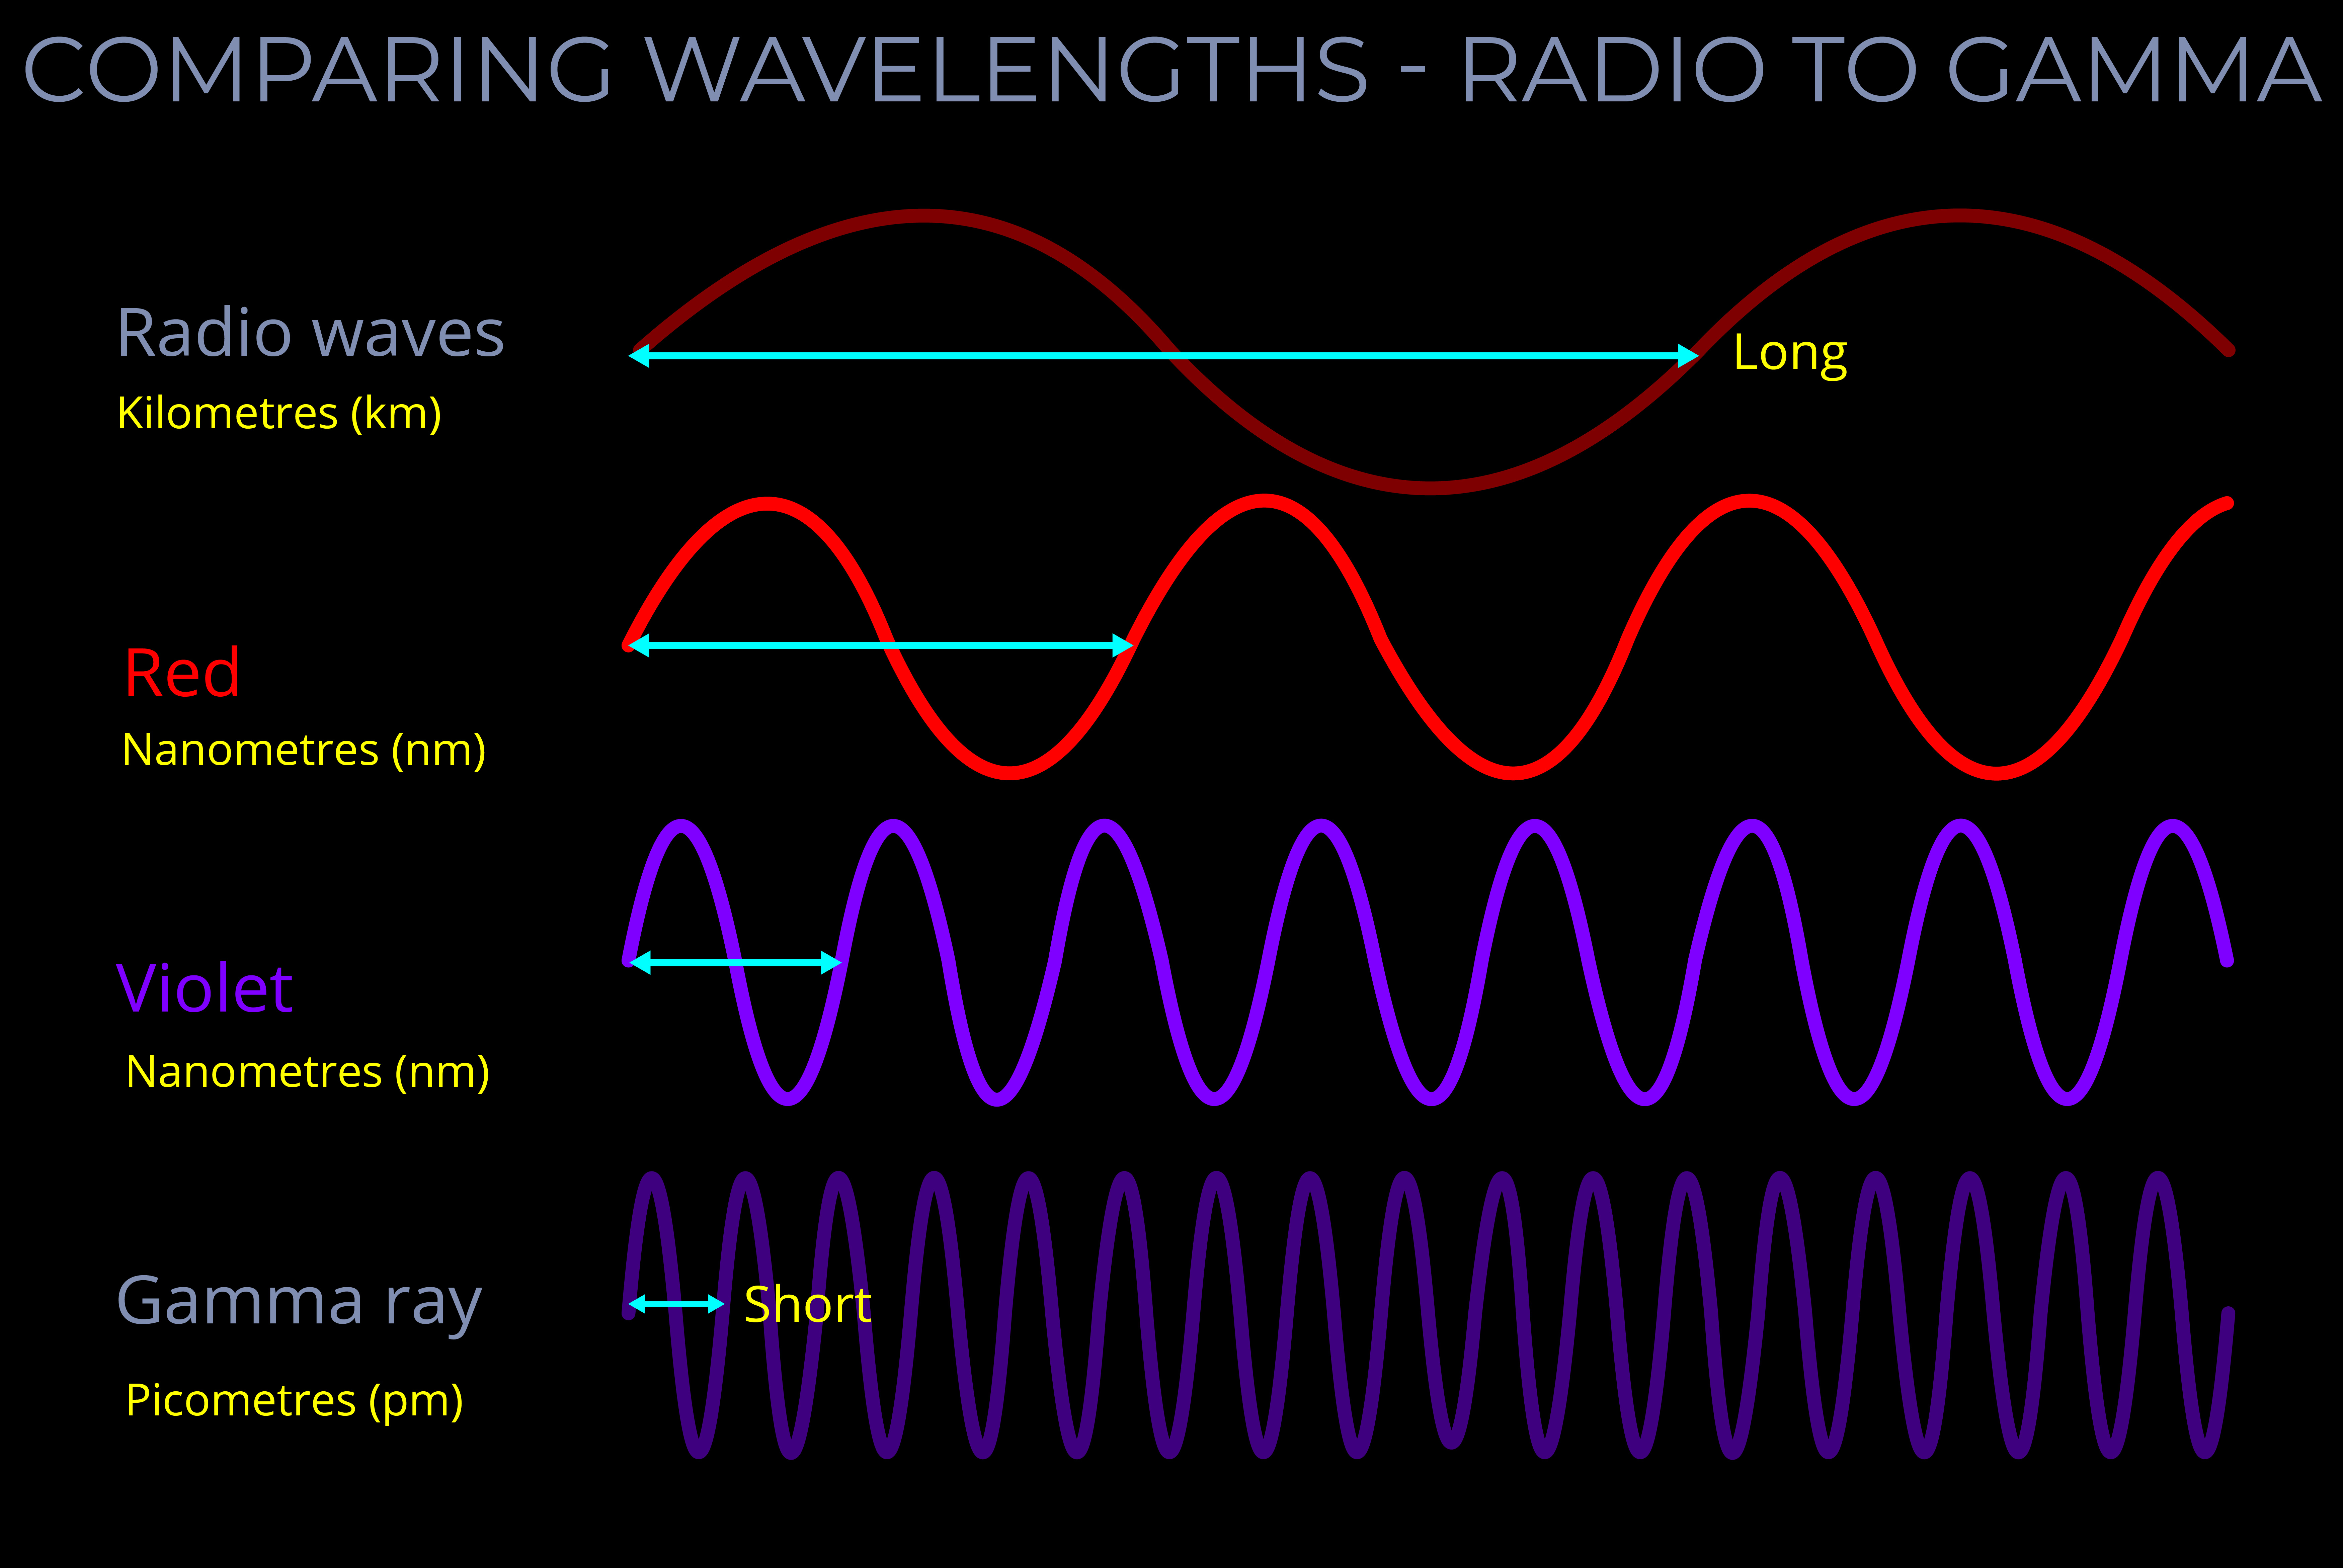
Comparing Wavelengths - Radio to Gamma

In the above image, which type of wave has the second highest and second lowest frequency?

It might help you to determine which waves had the highest and lowest frequencies.

Second Highest

Second Lowest

Examine the wavelengths in the image above - determine which had the greatest and lowest wavelength.

Greatest wavelength

Lowest wavelength

Use your examination of frequency and wavelength to complete the following:

As wavelength increases, frequency ; as wavelength decreases, frequency .

Otázka 13
13.

Comparing Wavelengths - Radio to Gamma

What were you looking for in the above image to determine your answers to the prior question?

