Copy of 6.) Wave Properties - Models (5/28/2026)
star
star
star
star
star
Last updated 3 months ago
13 Nsɛmmisa
Part 1
3
1
1
Part 2
2
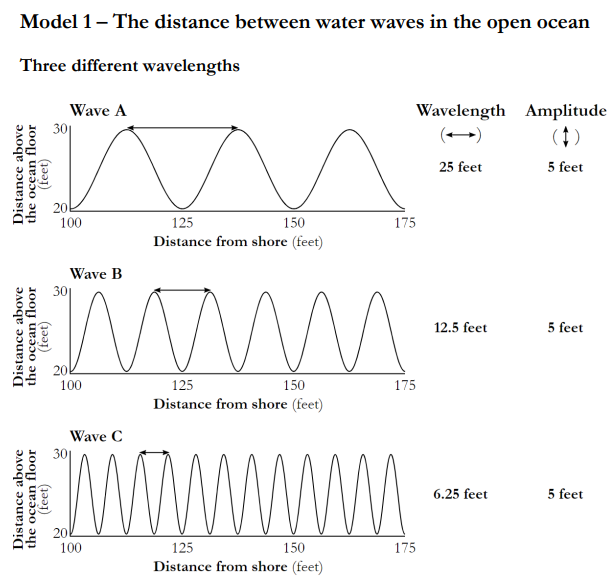
a.) How many differing wavelengths are shown in model?
b.) What does the x-axis represent in the model?
c.)Examine each wave in the model, look at their amplitude and wavelength, and consider their units.
Wave | Wavelength | Amplitude |
|---|---|---|
A | ||
B | ||
C |
Do you see a pattern between the amplitude and wavelength whenever there is a change in wavelength?
Examine the data table you completed, above, and then choose the answer(s) that best describes the relationship with between the amplitude and wavelength in the model.
For each wave, insert a verticle double-arrow to indicate the amplitude for each.
You do not need to label them.
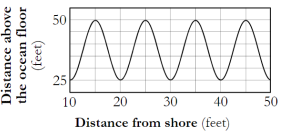
a.) What would the wavelength of the waves in the model to the left be?
b.) What about the amplitude?
Don't forget the units.
The model on top was used in the earlier questions, the model on the bottom will primarily be what is used in this section of questions.
Compare these two models paying special attention to the x-axes used in the three graphs in each model.
How are the x-axes in Model 1 (top model) and Model 2 (bottom model) different?
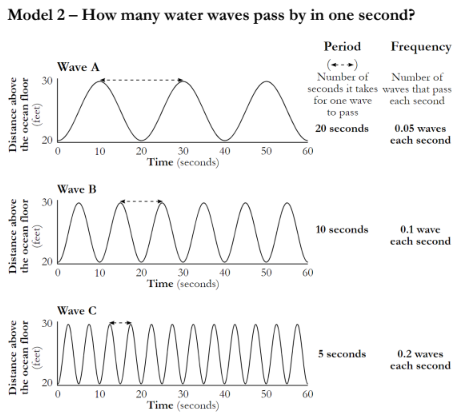 Examine the above model. What does the double arrow symbol (⇠
Circle the "period" in each graph in the model.
Find the word "Frequency" in the model to the left.
What is the definition provided there?
Use the information found in each wave in models 1 and 2 to complete the data table below.
Wave | Wavelength (feet) | Frequency (waves/sec) |
|---|---|---|
A | ||
B | ||
C |
Look for a pattern in the wavelengh and frequency data. Use that pattern to answer the following.
a.) As wavelength decreases, the frequency
b.) As the wavelength increases, the frequency
If we were to add a Wave D to each model following the same pattern of the wavelength vs frequency data found in the above two questions.
If the wavelength of the hypothetical Wave D is 3 feet, predict the likely frequency of Wave D.
Don't forget the units for frequency - see the data table on #7.
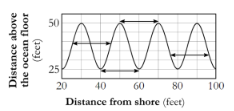 What is the length of each arrow (include the units in your answer)? Would the arrows be displaying wavelength, frequency, or something else (if so, what)?
Consider the difference in the x-axes in each graph of the above two models prior to answering the following question.
Compare the sets of arrows used in Model 1 vs Model 2.
Briefly state the difference in the meaning of the arrows - what different things do the arrows highlight in Model 1 vs Model 2?