Log in
Sign up for FREE
arrow_back
Library

Copy of Electrocardiogram Activity (5/28/2026)

star
star
star
star
star
Last updated about 2 hours ago
8 questions
Note from the author:
5
1
3
1
4
Question 5
5.
a. Bipolar limb leads measure voltage between _______ .

b. Lead I measures voltage between the _______ and the _______ .

c. Unipolar limb leads are placed on the arms and leg, including AVR, AVL, and _______ .
7
Question 6
6.
9
Question 7
7.
8
Question 8
8.
Depolarization vs. Repolarization of Cardiac Muscles

Heart Cells and Electrical Conduction:
  • Specialized heart cells in the atria and ventricles are part of the heart's electrical conduction system.
  • When resting, these cells are negatively charged (polarized).
Depolarization:
  • Depolarization occurs when electrical stimulation, such as from the SA node, shifts ion concentrations.
  • In a resting state, sodium ions are more concentrated outside the cell.
  • Upon stimulation, the cell membrane becomes permeable to sodium, allowing sodium to rush inside, making the cell positively charged.
  • This change leads to the contraction of the heart cell.
Repolarization:
  • After depolarization, the cell returns to its resting state (repolarization), restoring the negative charge.
Wave Patterns on an ECG

Three Primary Wave Patterns:
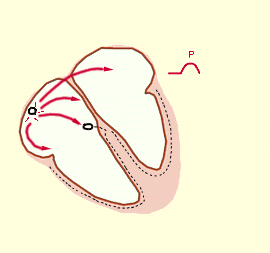
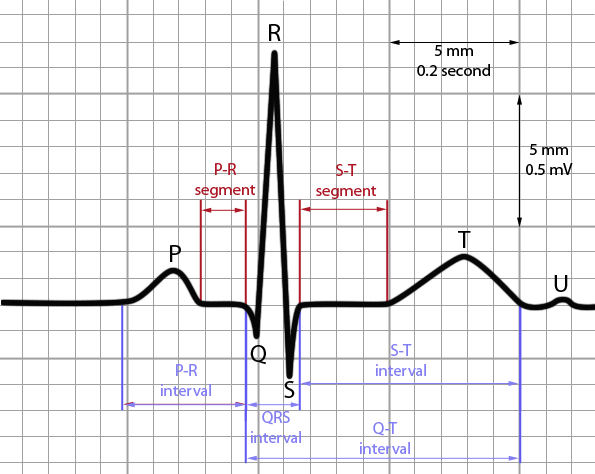
  1. P-wave - created by the spread of atrial depolarization.
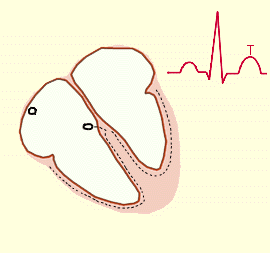
  2. QRS-wave (complex) - starts with the Q wave, which is an optional downward deflection that can occur immediately after the P wave. The R wave follows as an upward deflection, indicating the peak of the ventricular depolarization. The S wave is a downward deflection that comes after the R wave. The sequence of these waves reflects the spread of electrical activity through the ventricles, starting from the interventricular septum and moving outward to the ventricular walls. During the period of ventricular depolarization, the atria will repolarize after their depolarization at the p-wave; however, the QRS complex is so pronounced that it masks the repolarization of the atria on the ECG.
  3. T-wave - created by the repolarization of the ventricles.
Question 1
1.
a. Specialized heart cells in the atria and ventricles are part of the heart's _______ system.

b. When resting, heart cells are negatively charged, a state known as _______ .

c. Depolarization occurs when electrical stimulation, such as from the _______ , shifts ion concentrations.

d. In a resting state, sodium ions are more concentrated _______ the cell.

e. After depolarization, the cell returns to its resting state, known as _______ .
Question 2
2.

Question 3
3.
a. During ventricular depolarization, the atria will _______ before the QRS complex is observed.
b. The T-wave on an ECG is created by the _______ of the _______ .
Question 4
4.

Types of ECG Recording Electrodes (Leads)

Bipolar Limb Leads
  • Named "bipolar" because it measures voltage between two electrodes (leads).
  • One electrode is placed on each wrist and one is placed on the left ankle; alternatively, the electrodes can be placed on the shoulders instead of the wrists and on the left abdomen instead of the leg.
  • Record voltage between electrodes placed on the wrists and legs.
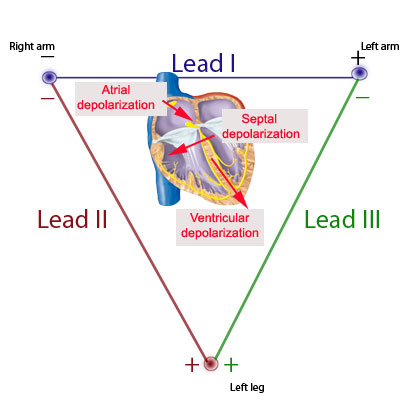
  • Lead I - measures voltage between the right arm and left arm.
  • Lead II - measures voltage between the right arm and left leg.
  • Lead III - measures voltage between the left arm and left leg.
Unipolar Limb Leads
  • Measures voltage from one electrode.
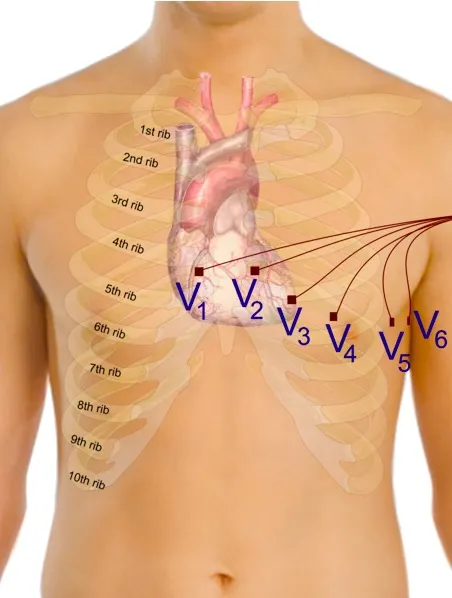
  • Often uses 9 or 12 leads placed on the limbs (AVR, AVL, and AVF) and various locations of the chest (V1-V6).
  • AVR - right arm; AVL - left arm; AVF - left leg.
  • V1 - 4th intercostal space to the right of the sternum.
  • V2 - 4th intercostal space to the left of the sternum.
  • V3 - 5th intercostal space to the left of the sternum.
  • V4 - 5th intercostal space in line with the middle of the clavicle (collarbone).
  • V5 - 5th intercostal space to the left of V4.
  • V6 - 5th intercostal space in line with the middle of the axilla (armpit).

Activation of the Heart and the ECG

The electrical activity of the heart originates in the sinoatrial node.  The impulse then rapidly spreads through the right atrium to the atrioventricular node.  It also spreads through the atrial muscle directly from the right atrium to the left atrium. The P-wave is generated by activation of the muscle of both atria.


The impulse travels very slowly through the AV node, then very quickly through the bundle of His,  then the bundle branches, the Purkinje network, and finally the ventricular muscle.

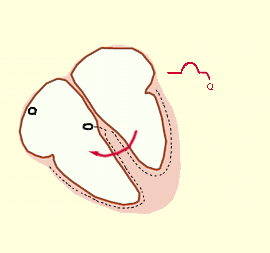
The first area of the ventricular muscle to be activated is the interventricular septum, which activates from left to right.  This generates the Q-wave.


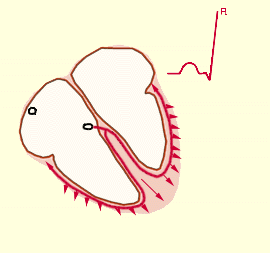
Next, the left and right ventricular free walls, which form the bulk of the muscle of both ventricles, gets activated, with the endocardial surface being activated before the epicardial surface.   This generates the R-wave.


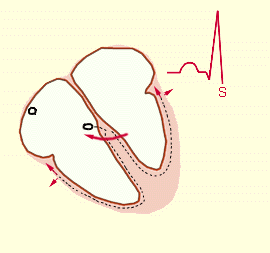
A few small areas of the ventricles are activated at a rather late stage.  This generates the S-wave.


Finally, the ventricular muscle repolarizes. This generates the T-wave.


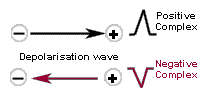
To understand the morphology of the ECG waveforms one needs to appreciate only one biophysical fact: if a wavefront of depolarization travels towards the electrode attached to the + input terminal of the ECG amplifier and away from the electrode attached to the - terminal, a positive-going deflection will result.  If the waveform travels away from the + electrode towards the - electrode, a negative going deflection will be seen. 
If the waveform is travelling in a direction perpendicular to the line joining the sites where the two electrodes are placed, no deflection or a biphasic deflection will be produced.


One can thus see that the voltage recorded along a particular lead axis (the vector joining the - to the + electrode) at a particular time is obtained by taking a projection onto that axis of the vector representing the magnitude and direction of depolarization at that time.  Thus, when the lead axis in the figure above points from left to right, parallel to the direction of movement of depolarization, a positive-going complex results.  When the two directions are anti-parallel, a negative-going complex is produced.

From the principles outlined above, one can determine how the ECG waveforms arise at each point in time.  For example, since the direction of atrial depolarization is almost exactly parallel to the axis of lead II (which is from RA to LL), a positive-going deflection (P wave) would result in that lead.

Since the ventricular muscle is much thicker in the left than in the right ventricle, the summated depolarization of the two ventricles is downwards and toward the left leg:   this produces again a positive-going deflection (R-wave) in lead II, since the depolarization vector is in the same direction as the lead II axis.

As septal depolarization moves from left to right, the depolarization vector is directed towards the - electrode of lead II (RA), and therefore a negative-going deflection (Q-wave) is produced.
a. The electrical activity of the heart originates in the _______

b. The impulse spreads through the right atrium to the _______ .

c. The P-wave is generated by activation of the muscle of both _______

d. The impulse travels very slowly through the AV node and then very quickly through the _______

e. The first area of the ventricular muscle to be activated is the _______

f. The R-wave is generated when the left and right ventricular free walls are activated, with the _______ being activated before the epicardial surface.

h. The T-wave is generated when the ventricles _______ .
Cardiac axis

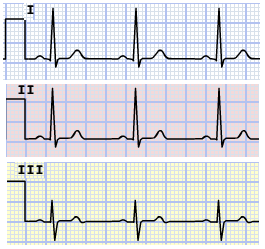
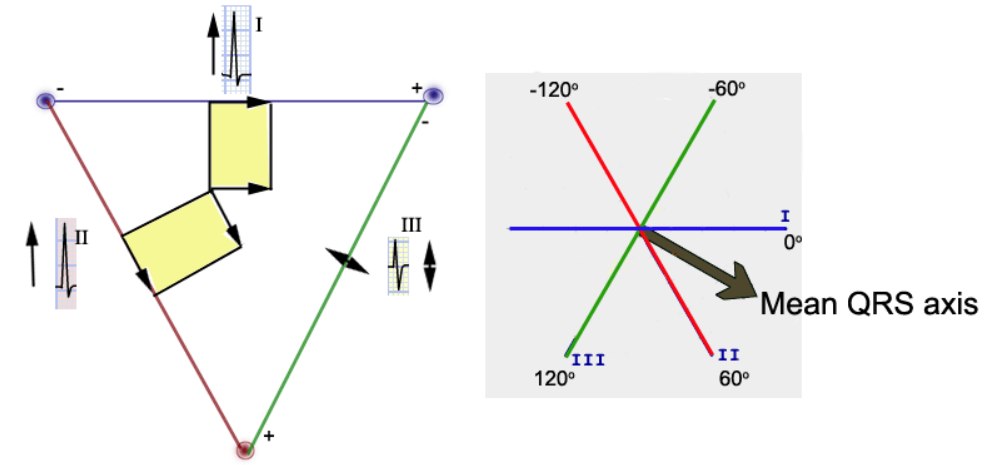
The cardiac axis refers to the mean direction of the wave of ventricular depolarization in the frontal plane, measured from a zero reference point. The mean QRS axis is obtained from measurements of the heights of the QRS waves in the 3 leads.

In the example to the below, notice that there are tall R waves in leads I and II, and that in lead III, the R and the S waves are of equal size and opposite direction.


Let us now calculate the direction of depolarization of the ventricular muscle. We have to arrive at a vector such that the projections of this vector onto the three lead axes is consistent with the height of the QRS complexes in the three leads.
COMMON MISCONCEPTIONS ABOUT THE ECG
  1. The PR interval is NOT in general measured from the P wave to the R wave. It is rather defined to be the time from the beginning of the P-wave to the beginning of the QRS complex. Thus the PR interval is measured from the beginning of the P-wave to the beginning of the R-wave only if the first deflection in the QRS complex happens to be an R-wave (i.e. no Q-wave present).
  2. Similarly, the QT interval is NOT in general measured from the Q-wave to the T-wave. It is rather defined as the time from the beginning of the QRS complex to the end of the T-wave.
  3. The P-wave (QRS complex) is NOT generated by the contraction of the atria (ventricles). It is generated by electrical activity (more specifically depolarization or activation) of the muscle.
  4. Purkinje fiber cells are NOT nerve cells. Rather, they are specialized cardiac muscle cells. The sinoatrial node, atrioventricular node, bundle of His, and bundle branches are also made up of specialized cardiac muscle cells.
The following statements are true:
  1. One does NOT see any deflection on the ECG during the time that the sinoatrial node is being depolarized. The depolarization of the atrioventricular node and the His-Purkinje system also does not generate any electrical activity that is detectable in the ECG.
  2. One does not necessarily see a Q-wave or an R-wave or an S-wave in each lead that one examines. Indeed, in some individuals with perfectly normal hearts, there is no Q-wave present in any of the three leads I-III. Other normal individuals have no S-waves in any of the three leads.
a. The PR interval is defined as the time from the beginning of the P-wave to the beginning of the _______ .

b. The QT interval is defined as the time from the beginning of the QRS complex to the end of the _______

c. The P-wave and QRS complex are generated by electrical activity, specifically by the _______ of the muscle.

d. Purkinje fiber cells are specialized _______ , not nerve cells.

e. During the depolarization of the sinoatrial node, one does NOT see any _______ on the ECG.

f. The _______ of the atrioventricular node and the His-Purkinje system does not generate detectable electrical activity on the ECG.

g. One does not necessarily see a _______ -wave, _______ -wave, or an _______ -wave in each lead that one examines.
Cardiac Arrhythmias

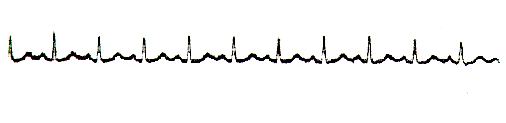
1) Sinus Tachycardia
Sinus tachycardia occurs in adults when impulses originate at the SA node at a rate greater than 100 per minute .   It may or may not be clinically significant, and is not in itself indicative of cardiac disease. (For example, sinus tachycardia may be associated with fever or exercise.)


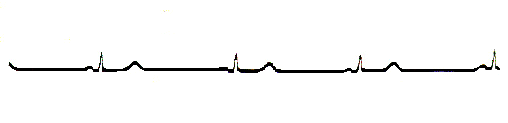
2) Sinus Bradycardia
Sinus bradycardia occurs when impulses originate at the SA node at a rate of less than 60 per minute. Sinus bradycardia is not necessarily indicative of cardiac disease, and is often seen in athletes and during sleep.


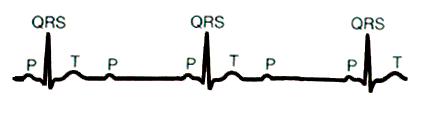
3) Atrioventricular (AV) block

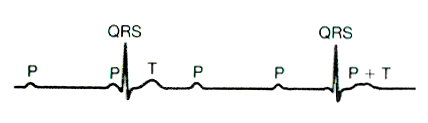
Partial AV block occurs when AV node damage prevents some atrial impulses from being transmitted to the ventricles.  In the particular case illustrated, every second P wave is not followed by QRS and T waves, producing 2:1 AV block.  It is said that there are "dropped beats" of the ventricles.


Complete AV block:  When the condition that is causing poor conduction in the AV node becomes severe, there is a complete block of the impulses from the atria to the ventricles. In that case, a subsidiary pacemaker can arise in the ventricles, which then paces the ventricular muscle.  There is then no synchronization between atrial and ventricular electrical activity.  The ventricles have "escaped" from atrial control, and are beating at their own natural rate, which is typically much less than the sinus rate.


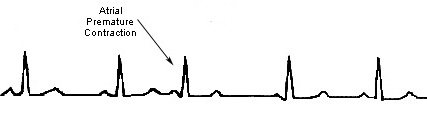
4) Premature Contractions - A premature contraction occurs when the heart contracts prior to the time when normal contraction is expected.  Some premature contractions are due to ectopic foci in the heart, which emit abnormal impulses at abnormal times during the cardiac rhythm. The ectopic focus can be situated anywhere in the heart. In the case of a premature contraction, the PR interval is often shorter for the premature beat than for the normal sinus beat.


5) Ventricular Fibrillation
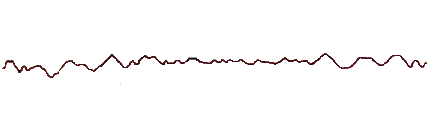
In ventricular fibrillation, multiple impulses are simultaneously traveling in different directions through the ventricles.  If left untreated, ventricular fibrillation results in death within about 2-4 minutes.  Although electric shock can initiate ventricular fibrillation, a very strong electrical current passed through the ventricles for a short period of time can actually stop fibrillation ("defibrillation").  The defibrillation shock stimulates all parts of the ventricles simultaneously and puts them in the same state of refractoriness, allowing the SA node or some other part of the heart to become the pacemaker when the heart starts to beat again.

a. Sinus tachycardia occurs when impulses originate at the SA node at a rate greater than _______ per minute.

b. Sinus bradycardia occurs when impulses originate at the SA node at a rate of less than _______ per minute.

c. _______ occurs when AV node damage prevents some atrial impulses from being transmitted to the ventricles.

d. In _______ , a subsidiary pacemaker can arise in the ventricles, which then paces the ventricular muscle.

e. A premature contraction occurs when the heart contracts _______ the time when normal contraction is expected.

f. The PR interval is often _______ for the premature beat than for the normal sinus beat.

g. _______ can stop ventricular fibrillation by stimulating all parts of the ventricles simultaneously and putting them in the same state of _______ .
Which of the following waves are part of the ECG? (Select all that apply)
Q-wave
QRS complex
T-wave
P-wave
The sequence of the QRS wave reflects the spread of electrical activity through the ___.
atria
ventricles
Purkinje fibers
SA node
cardiac veins