Log in
Sign up for FREE
arrow_back
Library

Copy of Electrocardiogram Interpretations (5/28/2026)

star
star
star
star
star
Last updated about 2 hours ago
36 questions
Self-Instructional
1
1
1
1
1
1
1
1
4
5
5
1
1
1
1
1
1
1
1
1
1
1
1
1
1
Case Studies
1
1
1
1
1
1
1
1
1
1
1
Question 1
1.

Question 2
2.

Question 3
3.
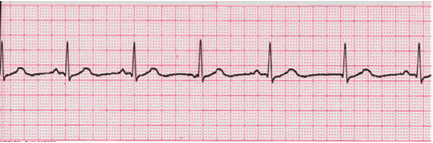
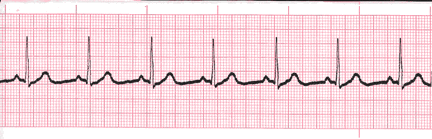
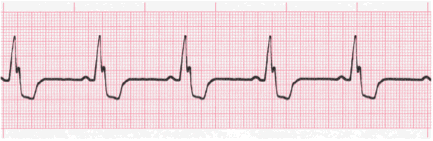
Heart Rate Practice 1 - Analyze the tracing. What is the heart rate? _______

Question 4
4.
Heart Rate Practice 2 - Analyze the tracing. What is the heart rate? _______

Step 3 P wave Morphology (Shape) ECG Interpretation

Description

  • The lead most commonly referenced in cardiac monitoring is lead II.
  • For the purposes of this training module, lead two will specifically be referenced unless otherwise specified.
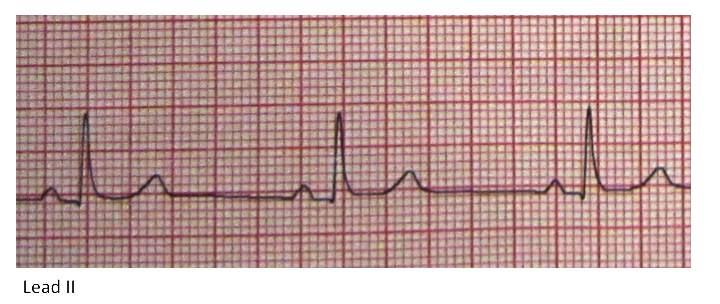
  • The P wave in lead II in a normal heart is typically rounded and upright in appearance.
  • Changes in shape must be reported. This can be an indicator that the locus of stimulation is changing or the pathway taken is changing.
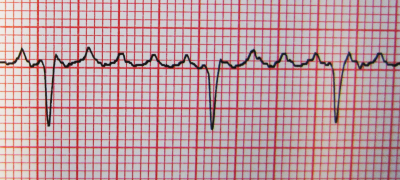
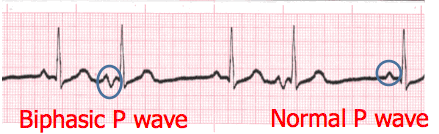
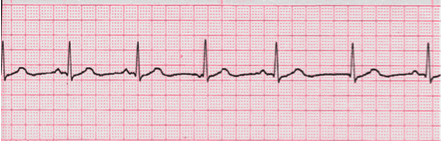
  • P waves may come in a variety of morphologies i.e. rounded and upright, peaked, flattened, notched, biphasic (second complex, pictured), inverted and even buried or absent!
  • Remember to describe the shape. This can be very important to the physician when diagnosing the patient.
  • Remember, the P-wave comes just prior to the QRS-complex.

Question 5
5.
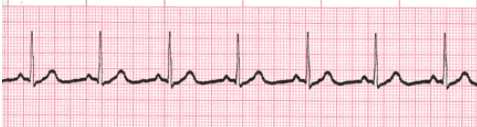
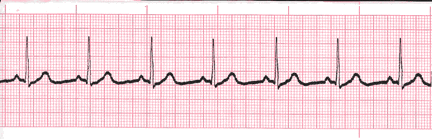
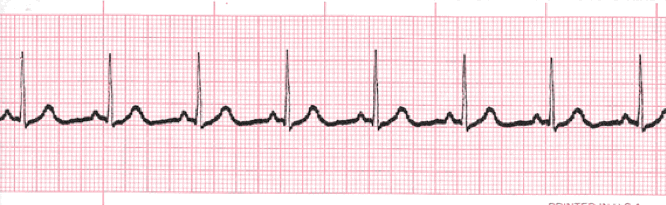
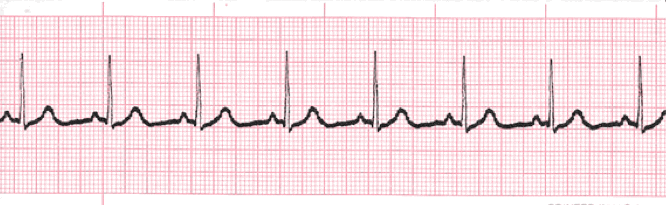
P-wave Practice 1 - Analyze the below tracing and use one or two words to describe the P-waves. _______

Question 6
6.
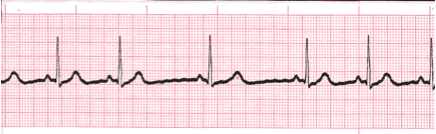
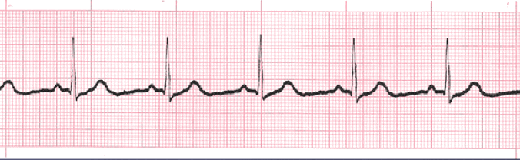
P-wave Practice 2 - Analyze the below tracing and use one or two words to describe the P-waves. _______

Step 4 PR interval (PRi) ECG Interpretation

Description

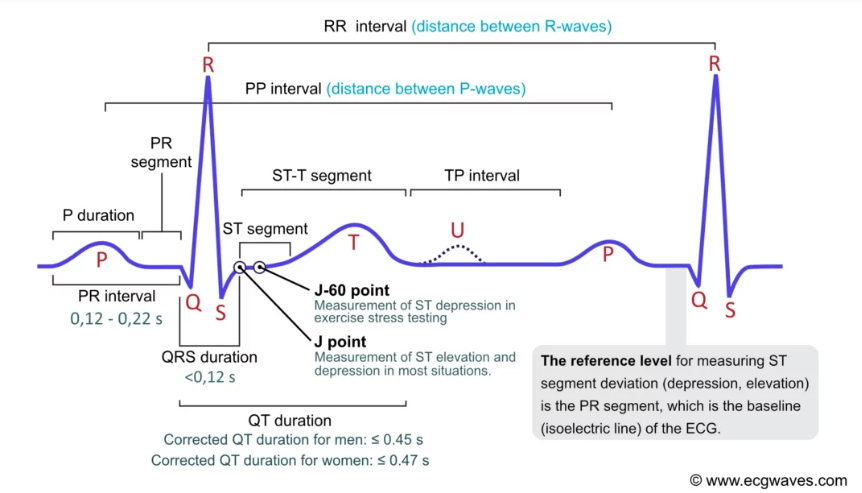
  • Measurement of the PR interval reflects the amount of time from the beginning of atrial depolarization to the beginning of ventricular depolarization.
  • Plainly stated, PR interval measurement is from the beginning of the P wave to the beginning of the QRS complex.
  • The normal range for PR interval is: 0.12 – 0.20 seconds (3 to 5 small boxes)
  • It is important that you measure each PR interval on the rhythm strip.
  • Some tracings do not have the same PRi measurement from one cardiac complex to the next. Sometimes there is a prolonging pattern, sometimes not.
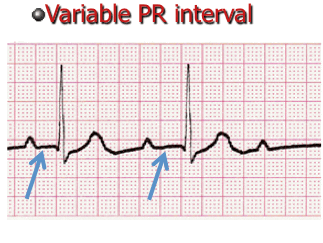
  • If the PR intervals are variable, report them as variable, but note if a pattern is present or not.
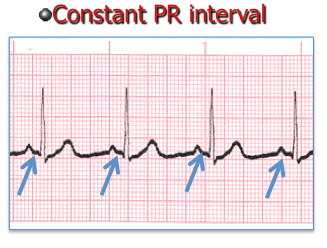
  • To calculate the PR interval, first determine if it is a regular and constant PR interval; if it is regular and constant, count the number of small boxes in the PR interval and multiply that number by 0.04.
  • If the PR interval is irregular, you will not be able to measure or calculate the PR interval; however, you will be able to describe the irregularity, instead.

Regular and Constant - Notice in the above tracing that the distance between the P and R waves is generally constant without any change from one to the other.

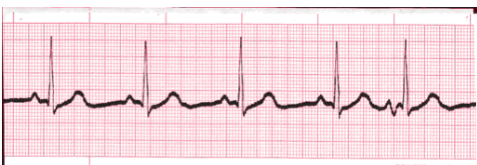
Irregular - Notice in the above tracing that the distance between the P and R waves changes slightly from one to the other. The first PR interval is a little shorter than the second PR interval
Question 7
7.
PR Interval Practice 1 - Measure the distance of the PR intervals in the below tracing.

Number of small boxes _______
PR Interval Time _______ sec

Question 8
8.
PR Interval Practice 2 - Describe the PR intervals in the below tracing. _______

Step 5 QRS Complex ECG Interpretation

Description

  • The QRS represents ventricular depolarization.
  • It is very important to analyze each QRS complex on the tracing and report the duration measurement and describe the shape (including any changes in shape).
  • As discussed earlier in step 3, when referring to P waves, remember changes in the shape of the waveform can indicate the locus of stimulation has changed or a different conduction pathway was followed. It is no different when analyzing the QRS complex.
  • The difference is that in step 3, we were looking at atrial activity. Now we are looking at ventricular activity.
  • Measure QRS complex from the beginning to the end of ventricular depolarization.
  • To determine QRS duration, count the number of small boxes present in the QRS complex and multiply it by 0.04.


Description 2 (below tracing)

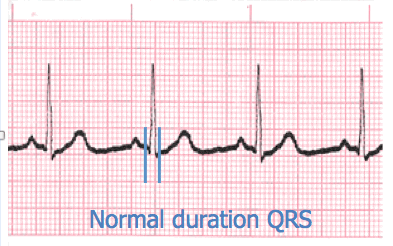
  • The normal duration of the QRS complex measures from: 0.06 – 0.10 second
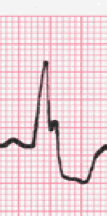
  • When the QRS measurement is 0.12 seconds or greater it indicates a delay in the electrical impulse as it is passing through the ventricular conduction system
  • This indicates an abnormal QRS interval duration.

Question 9
9.
QRS Interval Measurement 1 - analyze the below tracing. What is the QRS duration? _______ seconds; would this QRS duration be considered normal or abnormal? _______


QRS Interval Measurement 2 - analyze the below tracing. What is the QRS duration? _______ seconds; would this QRS duration be considered normal or abnormal? _______

ECG Interpretation - Sinus Rhythms

Introduction

  • The previous slides presented the five-steps of rhythm analysis. These five steps must be followed regardless of how simple of complex the tracing is you are reviewing.
  • The information gathered in these steps are telling a story.
  • The title of that story is the interpretation.

Sinus Rhythm Types

The dysrhythmias in this category occur as a result of influences on the Sinoatrial (SA) node. Rhythms in this category will share similarities in a normal appearing P wave, the PR interval will measure in the “normal range” of 0.12 – 0.20 second, and the QRS typically will measure in the “normal range” of 0.06 – 0.10 second. For the most part, dysrhythmias in this category either effect the rate, rhythm regularity or both within a particular tracing. We will be discussing the following complexes and rhythms:
  • Normal Sinus Rhythm
  • Sinus Bradycardia
  • Sinus Tachycardia
  • Sinus Dysrhythmia (Arrhythmia)
  • Sinus Arrest
  • Sinus Exit Block

Normal Sinus Rhythm


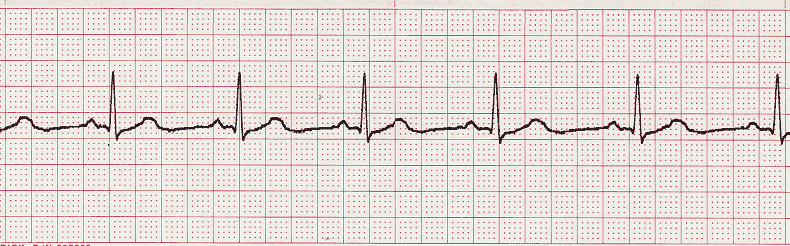
  • Also known as Sinus Rhythm, it is the only rhythm when each of the five steps of rhythm analysis are “normal”.
  • All other rhythms you will analyze will have at least one of the 5-steps presenting an abnormality.
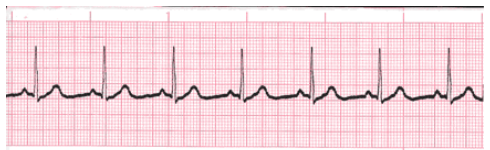
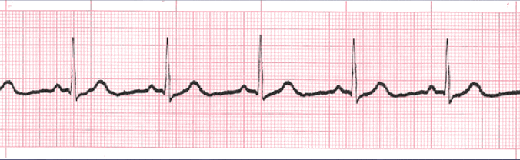
  • This rhythm will be regular, in a heart rate range between 60 – 100 bpm, P waves are upright and uniform in appearance (in Lead II), with a P wave for each QRS complex, the PR interval will measure in the normal range of 0.12 – 0.20 second (and measure the same each time), and the QRS complex morphology will be similar beat-to-beat and measure between 0.06 – 0.10 second (and measure the same each time).
Question 10
10.
Practice Strip - Analyze the normal sinus rhythm in the below tracing and describe if the rhythm is regular or irregular, calculate the rate, describe the P-wave, calculate the PR interval, and calculate the QRS duration.

Rhythm: _______
Rate: _______ bpm
P-wave: _______
PR-interval: _______ sec.
QRS duration: _______ sec.

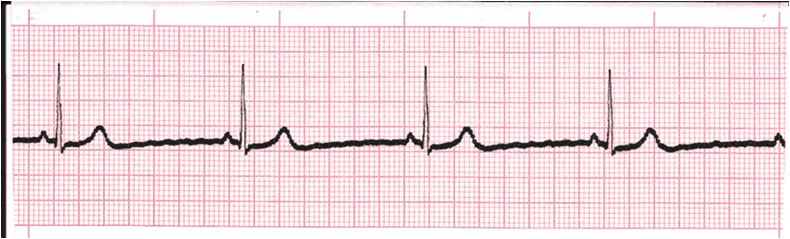
Sinus Bradycardia


Description

  • Rhythms are often named according to the origin of the electrical activity in the heart or the structure where the problem is occurring.
  • Sinus Rhythms are aptly named due to the locus of stimulation being the SA (sinoatrial) node.
  • With Sinus Bradycardia the locus of stimulation is the same as normal sinus rhythm, just now the rate will be less than 60 bpm. Recall that “brady” means slow.
  • The only difference between sinus bradycardia and normal sinus rhythm is the rate. All other steps in the rhythm analysis are “normal”.
Question 11
11.
Practice Strip - Analyze the sinus bradycardia in the below tracing and describe if the rhythm is regular or irregular, calculate the rate, describe the P-wave, calculate the PR interval, and calculate the QRS duration.

Rhythm: _______
Rate: _______ bpm
P-wave: _______
PR-interval: _______ sec.
QRS duration: _______ sec.

Sinus Tachycardia ECG Interpretation


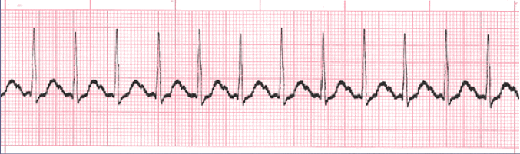
  • Sinus Tachycardia occurs when the rate of electrical impulse formation occurs at a rate exceeding 100 bpm.
  • This can occur for a number of different reasons i.e. diet, stress, illness, response to physical exertion etc.
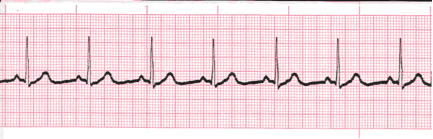
  • The only difference between Normal Sinus Rhythm and Sinus Tachycardia (Sinus Tach) is the rate exceeds 100 bpm. All other steps of rhythm analysis will be normal.
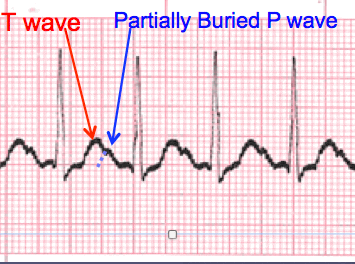
  • An additional challenge that will present as rhythm rates accelerate is that the cardiac complexes will come closer together. This can result in the P wave becoming partially or completely buried within the T wave of the previous cardiac complex.
  • The result of a partially buried P waves means you are unable to establish the beginning of atrial depolarization. Meaning you will be unable to measure and report the PR interval. The only way it will be possible is if the physician instructs you to increase the machine printing speed (remember interval times will double at 50 mm/sec).
Question 12
12.
Practice Strip - Analyze the sinus tachycardia in the below tracing and describe if the rhythm is regular or irregular, calculate the rate, describe the P-wave, calculate the PR interval, and calculate the QRS duration.


Rhythm _______
Rate _______ bpm
P-wave_______
PR-Interval _______
QRS Duration _______ sec

Sinus Dysrhythmia (Arrhythmia) ECG Interpretation


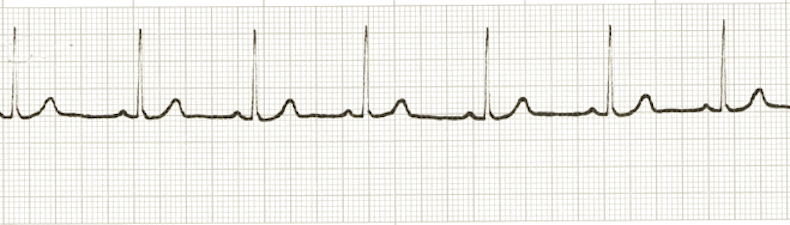
  • Sinus Dysrhythmia often occurs as a normal variant. It is commonly seen in young healthy people and athletes. It is frequently related to breathing and pressure on the vagus nerve. As the patient inhales and the lungs expand, pressure is applied to the vagus nerve which causes a parasympathetic response and a decrease in heart rate.
  • Sinus Dysrhythmia ECGs may also occur as a result of medication effects or diseases such as multiple sclerosis.
  • This dysrhythmia often requires no treatment, but may require medication or therapy such as a pacemaker to regulate the heart rate if the ventricular response becomes too slow.
  • Sinus Dysrhythmia closely resembles Normal Sinus Rhythm with the only distinction being the intervals from one cardiac complex to the next are changing as influenced by the patients respiratory pattern.
  • Note the changing R to R Intervals.
Question 13
13.
Practice Strip - Analyze the below tracing and describe if the rhythm is regular or irregular, calculate the rate, describe the P-wave, calculate the PR interval, and calculate the QRS duration.


Rhythm _______
Rate _______ bpm
P-wave_______
PR-Interval _______ sec
QRS Duration _______ sec

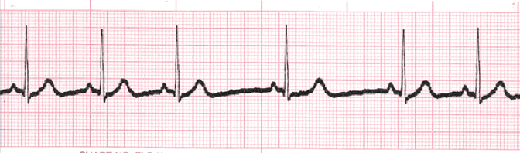
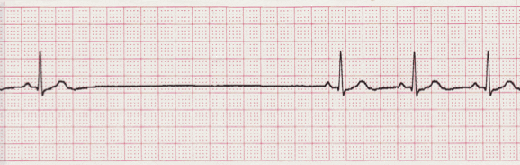
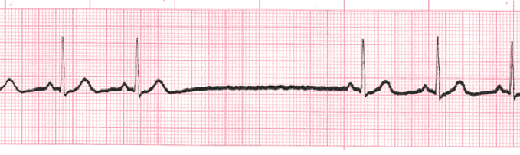
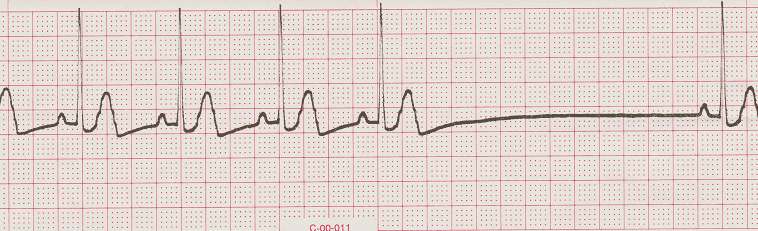
Sinus Arrest ECG Interpretation

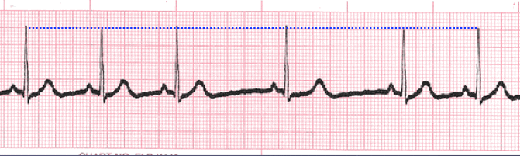
  • Sinus Arrest occurs when there is a sudden absence of electrical activity initiated by the SA node. This results in a pause in the electrical activity seen on the tracing. Remember, no electrical activity = no depolarization and contraction. Hence, a drop in blood pressure.
  • The longer the pause, the further the blood pressure will drop.
  • A pause of six-seconds is considered a medical emergency and emergency procedures must be initiated.
  • The ECG sinus arrest rhythm typically will demonstrate constant R to R intervals prior to and following the pause. This pause results in the rhythm tracing presenting as irregular.


  • It is important to measure the duration of the pause and report this information along with the frequency of the pauses if there are more than one.
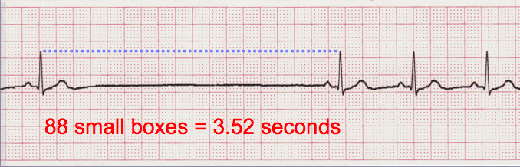
  • The pause is measured by placing your caliper tips on the last R wave just prior to the pause and the R wave immediately following the pause. Count the number of small boxes and multiply by 0.04 second. This will be reported as part of the interpretation.
Question 14
14.
Practice Strip - Analyze the below tracing and describe if the rhythm is regular or irregular, calculate the rate, describe the P-wave, calculate the PR interval, calculate the QRS duration, and calculate the pause.


Rhythm _______
Rate _______ bpm
P-wave_______
PR-Interval _______ sec
QRS Duration _______ sec
Pause Length_______ sec

Sinus Exit Block ECG Interpretation


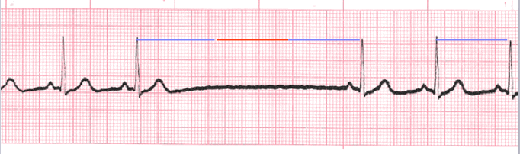
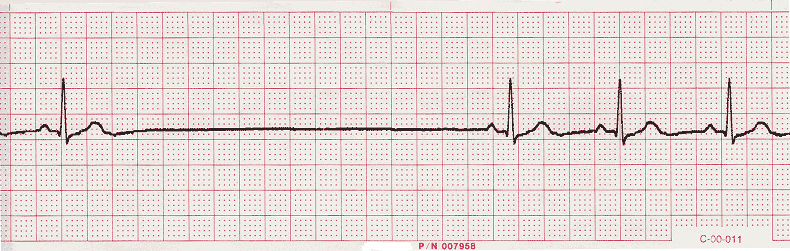
  • Sinus Exit Block looks very much the same as Sinus Arrest with one important distinction.
  • The duration of the pause with Sinus Exit Block is in a direct multiple of the R to R interval of the underlying rhythm. Sinus Arrest does not have this specific feature.
Question 15
15.
Practice Strip - Analyze the below tracing and describe if the rhythm is regular or irregular, calculate the rate, describe the P-wave, calculate the PR interval, calculate the QRS duration, and calculate the pause.


Rhythm _______
Rate _______ bpm
P-wave_______
PR-Interval _______ sec
QRS Duration _______ sec
Sinus Exit Block or Sinus Arrest? _______
Question 16
16.

Question 17
17.

Question 18
18.

Question 19
19.

Question 20
20.

Question 21
21.

Question 22
22.

Question 23
23.

Question 24
24.

Question 25
25.

Question 26
26.

Question 27
27.

Question 28
28.

Question 29
29.

Question 30
30.

Question 31
31.

Question 32
32.

Question 33
33.

Question 34
34.

Question 35
35.

Question 36
36.

Very Highly Recommended Step

  • During this activity, as you learn about how to analyze each item on an ECG, you should use the below doc to take notes, as they will help you on the practice questions and the quiz at the end of this.
  • Notes - https://docs.google.com/document/d/1fZTXkUPrcLBQhyHV9B-s2Ef6dJ2UMf9HeEwwNYQwsLE/edit?usp=sharing
  • This will be submitted at the end of this activity.

Step 1 Rhythm Analysis - ECG Interpretation

Introduction

  • When analyzing cardiac rhythm strips it is important to recognize what the cardiac complex represents and what is considered normal versus abnormal.
  • The technique and interpretation of cardiac rhythms is a combination of science and art.
  • The more you practice rhythm analysis the more comfortable you will be with the process involved and the intuitive aspects of interpretation.

Description

  • When a normal heart is beating this is the result of electrical impulses that spread through the atria and then the ventricles in an organized, sequential manner. Atria, then ventricles, atria, then ventricles over and over again.
  • When analyzing the tracing you will first check R wave to R wave across the strip. If the intervals vary by 1 ½ small boxes or less the rhythm is considered regular.
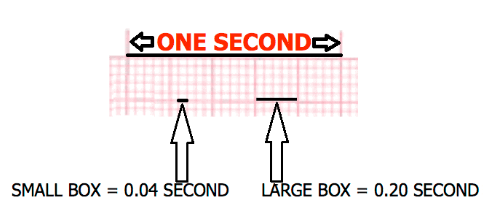
  • Regarding timing represented on a piece of graph paper on an ECG, one small box is 0.04 second and one large box is 0.20 second; this means that five small boxes are 1 second.

  • If you take your own pulse now and then again in 10 minutes it is unlikely that your heart rate will be exactly the same number. This is because of a number of factors all working together in an effort to maintain our body within a specific range of “normal”, often referred to as homeostasis.
  • R wave to R wave analysis refers to the rhythmicity of the ventricles.
  • Now measure the P wave to P wave intervals. This refers to the rhythmicity of the atria.

Rhythm Practice 1 - Analyze the tracing below. Is it regular or irregular (don't just guess to get done, but actually examine the tracing graph)?

Regular
Irregular
Rhythm Practice 2 - Analyze the tracing below. Is it regular or irregular (don't just guess to get done, but actually examine the tracing graph)?

Regular
Irregular

Step 2 Heart Rate Regular ECG Interpretation

This section discusses how to calculate the heart rate using ECG with regular and irregular rhythms.

Regular Rhythms

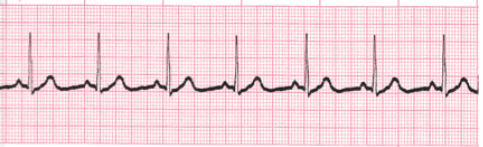
  • If the rhythm varies by less than two small boxes, then the rhythm is considered regular.
1. Regular Rhythms
  • Identify two consecutive R waves on the ECG paper.
  • Count the number of large squares (0.2s) between them.
  • Divide 300 (representing 1 minute) by that number to calculate heart rate.
2. Fast Rhythms
  • Identify two consecutive R waves on the ECG paper.
  • Count the number of small squares (0.04s) between them.
  • Divide 1500 (representing 1 minute) by that number to calculate heart rate.
3. Irregular Rhythms
  • Count the number of R waves over a 10 second period.
  • Multiply the number by 6 to calculate the average beats per minute (bpm).


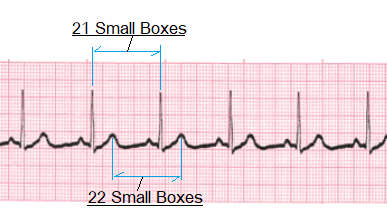
Heart Rate Calculation Example:


Example using the above tracing:
R-R = 21 small boxes
P-P = 22 small boxes
21 + 22 = 43
1500/43 = 34.8 = 35
Heart Rate = 35 bpm

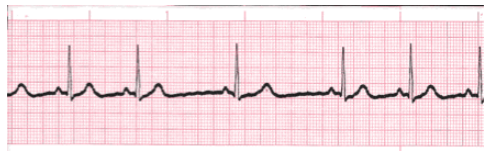
Irregular Rhythms

  • If the rhythm varies by two small boxes or more, the rhythm is considered “irregular”.
  • The heart rate determination technique used for irregular rhythms will be the “six-second technique”.
  • Simply count the number of complete cardiac complexes (QRS complex) in six seconds (represented by 30 large boxes on the tracing graph) and multiply by ten.
Above tracing displays 6 QRS-complexes in 6 seconds (30 large boxes).
6 x 10 = 60
Heart rate = 60 bpm
Interpret this tracing:

Sinus Tachycardia
Sinus Bradycardia
Sinus Arrhythmia
Sinus Arrest
Normal Sinus Rhythm
Interpret this tracing:

Normal Sinus Rhythm
Sinus Bradycardia
Sinus Arrhythmia
Sinus Arrest
Sinus Tachycardia
Interpret this tracing:

Sinus Arrest
Sinus Arrhythmia
Sinus Tachycardia
Normal Sinus Rhythm
Sinus Bradycardia
Interpret this tracing:

Normal Sinus Rhythm
Sinus Tachycardia
Sinus Arrhythmia
Sinus Bradycardia
Sinus Arrest
Interpret this tracing:

Normal Sinus Rhythm
Sinus Arrest
Sinus Arrhythmia
Sinus Tachycardia
Sinus Bradycardia
Interpret this tracing:

Sinus Arrest
Normal Sinus Rhythm
Sinus Tachycardia
Sinus Bradycardia
Sinus Arrhythmia
Interpret this tracing:

Sinus Tachycardia
Sinus Arrest
Sinus Arrhythmia
Normal Sinus Rhythm
Sinus Bradycardia
Interpret this tracing:

Sinus Tachycardia
Sinus Arrhythmia
Sinus Arrest
Normal Sinus Rhythm
Sinus Bradycardia
Interpret this tracing:

Sinus Arrest
Sinus Arrhythmia
Sinus Tachycardia
Normal Sinus Rhythm
Sinus Bradycardia
Interpret this tracing:

Sinus Tachycardia
Normal Sinus Rhythm
Sinus Arrhythmia
Sinus Arrest
Sinus Bradycardia
Compare the normal sinus rhythm to the list of arrhythmias.

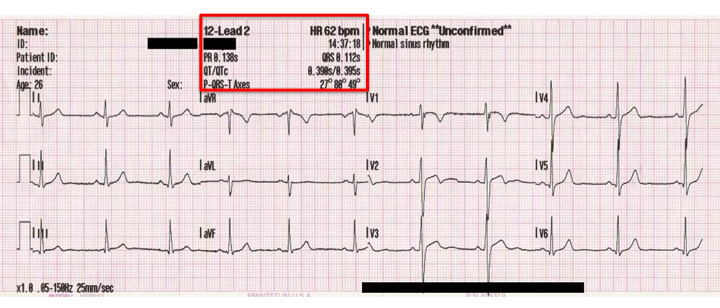
Normal Sinus Rhythm: 62 beats/min.

Sinus Tachycardia: >100/min at rest
Causes:
  • Anemia
  • Anxiety
  • Drugs that increase sympathetic tone (cocaine, amphetamines)
  • Dehydration
  • Fever
  • Hyperthyroidism
  • Myocardial infarction or Heart Failure
  • Pulmonary embolus
  • Pain
Sinus Bradycardia: < 60 bpm at rest

ECG Characteristics:
  • Heart rate <60/min at rest
  • Regular rhythm
  • Upright P waves
  • Normal PR interval
  • QRS complex normal in width & morphology
Causes:
  • Sleep (normal)
  • Hypothermia
  • Hypothyroidism
  • Drug-induced (digoxin, beta blockers, calcium channel blockers)
  • SA node dysfunction / old age
Atrial Fibrillation:
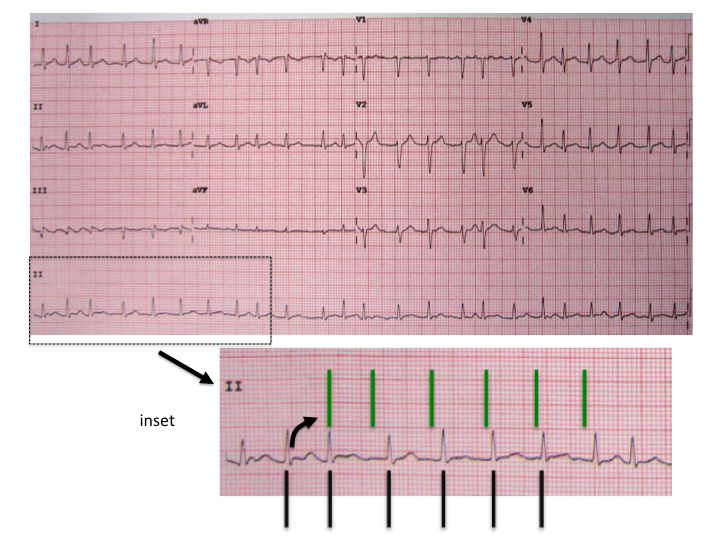
AFib ECG Characteristics:
  • absence of P waves
  • irregular ventricular rate
  • narrow QRS with normal morphology
Causes / Risk Factors:
  • Hypertension
  • Various forms of heart disease (e.g. coronary artery disease, mitral stenosis) resulting in atrial dilatation, inflammation or fibrosis of the atria
  • Hyperthyroidism
  • Pulmonary diseases
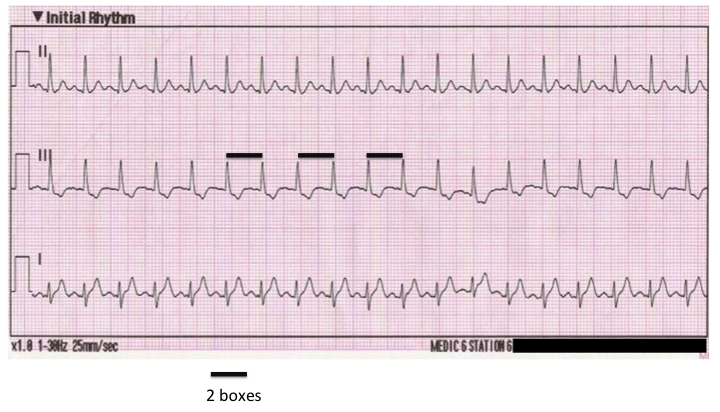
Atrial Flutter:

ECG Characteristics:
  • Atrial rate is typically 240-400 beats/min
  • Some degree of AV node conduction block is typically present (e.g. 5:1 to 2:1 conduction between the atria and ventricles)
  • There are different subtypes of atrial flutter. The most common form is “Type 1 atrial flutter” where there is a large reentrant loop that circles the right atrium, resulting in an atrial rate of 240-300 beats/min. The ECG in Type 1 atrial flutter can show either a negative sawtooth pattern or “flutter waves” in leads II,III and AVF due to a counterclockwise re-entrant atrial loop, or an upright pattern in these leads if the atrial re-entrant loop is clockwise in rotation.
  • Type II atrial flutter follows a different atrial pathway and has a higher rate of 340-400 beats/min.
  • Atrial flutter can degenerate into atrial fibrillation
Premature Ventricular Contraction (PVC):
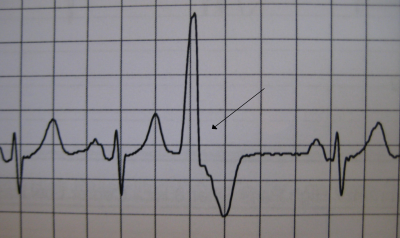
Explanation of the ECG Appearance of PVCs:
  • PVCs typically have a large amplitude and wide duration QRS & an inverted T wave: Wide QRS: The QRS is wide because the event does not utilize the His-Purkinje system to provide a rapid synchronized depolarization of the ventricular myocardium, and instead results from slower conduction through the ventricular muscle itself (e.g. from a site of origin in the right ventricle spreading through the muscle wall to the left ventricle). Large QRS Amplitude: The QRS amplitude is large because the spread of depolarization is one-directional (e.g. from right to left) and there is less cancellation of the depolarization vectors that normally occurs when both the right and left ventricular walls depolarize at the same time, and in opposite directions, from endocardium to epicardium. Inverted T wave: The T wave is inverted when ventricular repolarization follows in the same direction as ventricular depolarization, instead of occurring in the opposite direction from epicardium to endocardium (as it does normally).
Causes:
  • ischemia/hypoxia
  • cardiomyopathy
  • drugs (alcohol, caffeine, cocaine, tricyclic antidepressants)
  • electrolyte imbalance (hypokalemia, low magnesium levels)
  • myocarditis
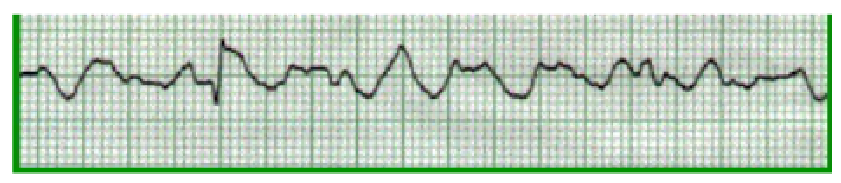
Ventricular Fibrillation:

ECG Characteristics:
  • rapid uncoordinated electrical depolarization of the ventricle
  • an undulating baseline (fine or coarse) with no consistent pattern of waves or complexes (P, QRS or T)
Causes:
  • ischemic heart disease
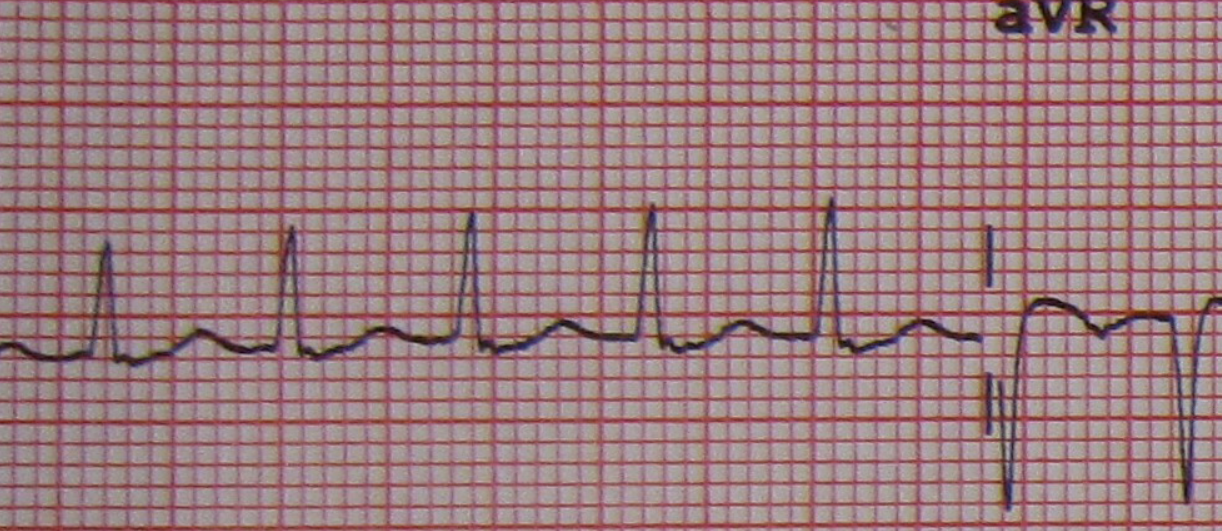
Paroxysmal Supraventricular Tachycardia (PSVT):
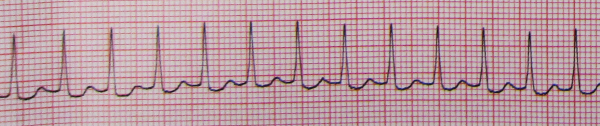
ECG Characteristics:
  • sudden onset (paroxysmal)
  • narrow QRS complex (<120 msec) tachycardia (typically 140-250 beats/min; can be slower)
  • P waves are either absent or inverted due to retrograde conduction from the AV node
  • regular ventricular rate
Cellular Mechanisms:
  • most commonly caused by reentry in the AV node (sometimes classified as “AVNRT” for AV Node Reentrant Tachycardia)
PSVT Signs & Symptoms:
  • Palpitations (98%)
  • Dizziness (78%)
  • Dyspnea (47%)
  • Chest pain (38%)
Conversion of PSVT to sinus rhythm by i.v. adenosine in a 27 year old man. Notice the slowing of heart rate from 213/min to 50-70/min after administration of adenosine, and the reappearance of P waves before each QRS complex.


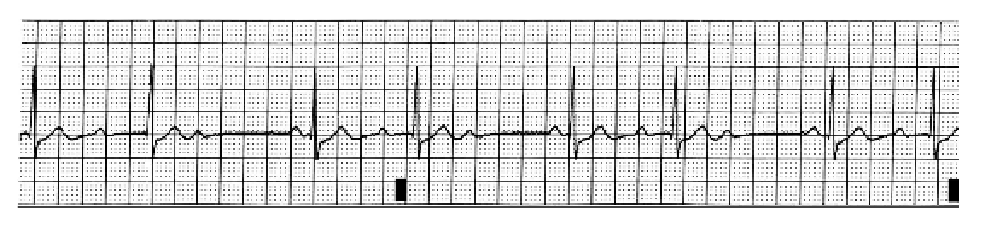
AV Node - 1st Degree Block:
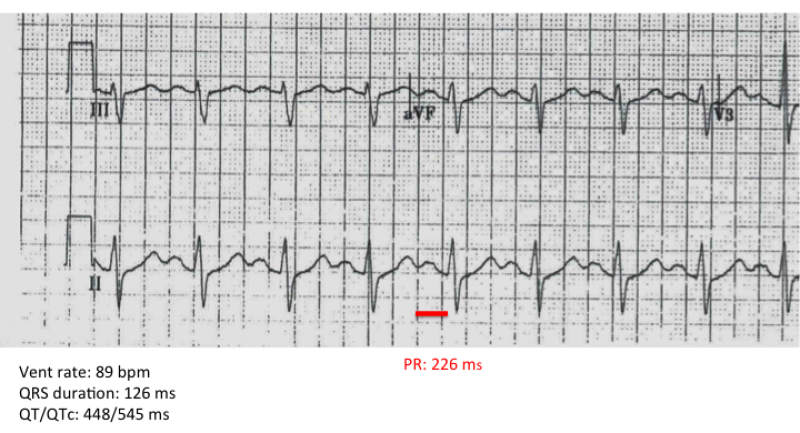
ECG Characteristics:
  • The PR interval is abnormally long (>0.2 seconds)
  • Every P wave is followed by a QRS and T wave There are as many P waves as QRS complexes
  • The ratio of Atrial to Ventricular conduction remains 1:1
  • see video section below
Causes:
  • AV nodal disease
  • Myocarditis
  • Acute inferior myocardial infarction
  • Enhanced vagal tone - atheletes - digoxin - cholinesterase inhibitors
  • Drugs: - non-dihydropyridine calcium channel blockers (verapamil, diltiazem) - beta blockers
2nd Degree AV Block, Mobitz Type I (Wenckebach Block):
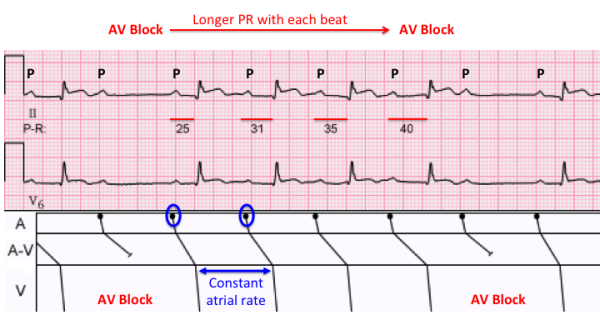
ECG Characteristics:
  • P waves are occasionally not followed by a QRS complex
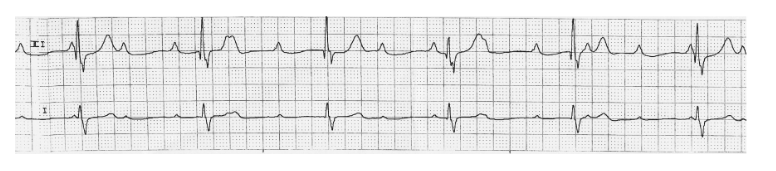
  • The PR interval becomes progressively prolonged over several beats before a non-conducted P wave occurs (referred to as the Wenckebach phenomenon) - The PR interval is longest immediately before a dropped beat (absence of a QRS after a P wave) - The PR interval is shortest immediately after a dropped beat - The greatest increase in PR duration typically occurs between the 1st and 2nd beats of a cycle
  • The Wenckebach pattern typically repeats in a ratio of P:QRS complexes of 3:2, 4:3 or 5:4 (more P waves than QRS complexes)
  • Administration of atropine typically improves AV conduction (e.g. atropine causes the AV conduction ratio to change from 5:1 to 3:2)
Causes:
  • Usually occurs within the AV node, but could result from delayed conduction from the SA node to the AV node
EW is a 52 year old man who is brought into the emergency department suffering from fatigue and dizziness. His ECG indicates a pattern in which P waves are present at a regular interval of 640 msec (94/min), while his QRS complexes occur at regular intervals of 1500 msec (40/min). The P waves also appear to be out-of-sync from the QRS complexes, and there is no consistent PR interval. The arrhythmia that best describes EW's arrhythmia is:

atrial fibrillation
1st degree AV conduction block
atrial flutter
3rd degree AV conduction block
2nd degree AV conduction block
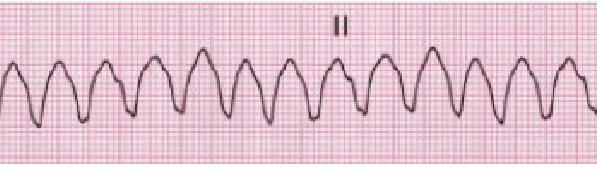
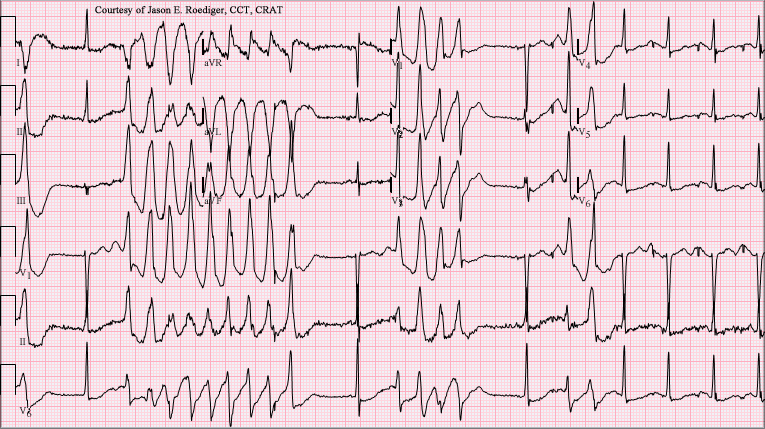
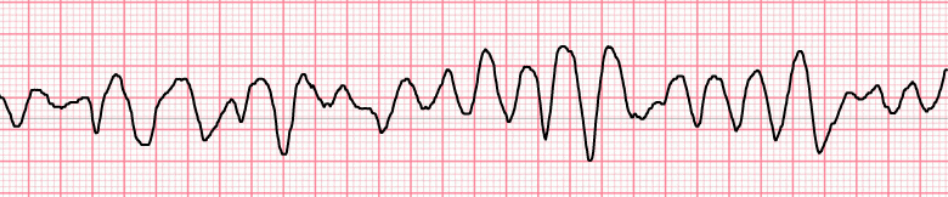
JH is a 59 year-old man recovering from a triple coronary artery bypass graft (CABG) sugery. While he is in the recovery room, his blood pressure drops to 40/10 mm Hg and the ECG monitor reveals the pattern shown below. You quickly realize that JH is suffering from:

ventricular fibrillation
paroxysmal supraventricular tachycardia (PSVT)
atrial flutter
ventricular tachycardia
atrial fibrillation
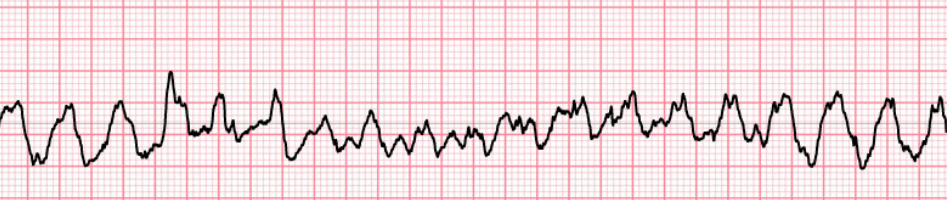
A valiant effort is made to convert JH's VTach to sinus rhythm by application of successive DC cardioverting "shocks" applied across the wall of his chest. After several minutes his ECG changes to the following pattern. This pattern represents:

ventricular fibrillation
atrial flutter
multifocal ventricular tachycardia
atrial fibrillation
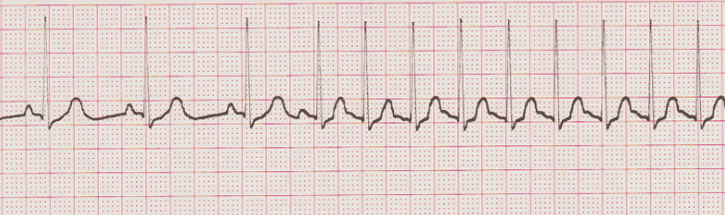
JH eventually responds to DC defibrillation after 3 or 4 attempts, and returns to a normal sinus rhythm. The next day his condition has improved and an ECG recording reveals the following pattern. JH's current rhythm disturbance is an example of:

second degree AV conduction block (Mobitz Type 1)
first degree AV conduction block
second degree AV conduction block (Mobitz Type 2)
third degree AV conduction block
atrial fibrillation
John D is a 62 year old patient with a history of heart disease who presents to the emergency department complaining of chest palpitations and dizziness that suddenly began 30 minutes ago. His ECG is shown below. What is the most likely mechanism for this arrhythmia?

atrial flutter
ventricular tachycardia
atrial fibrillation
AV node reentry
sinus tachycardia
Helen is a 72 year old patient who is brought to your emergency department by ambulance after having a fainting episode. She has a history of atrial fibrillation that has been up-to-now well controlled by sotalol (a Class III antiarrhythmic). Her ECG upon arrival is shown below. What rhythm disturbance does Helen have?
bundle branch block
paroxysmal supraventricular tachycardia
ventricular fibrillation
torsades de pointes
atrial fibrillation


Ventricular fibrillation
Supraventricular tachycardia
Atrial fibrillation
Asystole
Ventricular fibrillation
Atrial flutter
Ventricular tachycardia
Ventricular flutter
Ventricular flutter
Ventricular tachycardia
Atrial fibrillation
Ventricular fibrillation
Type I block
Ventricular tachycardia
Ventricular fibrillation
Ventricular flutter
Sinus bradycardia
Atrial flutter
Asystole
Supraventricular tachycardia
Atrial fibrillation
Atrial flutter
Atrial tachycardia