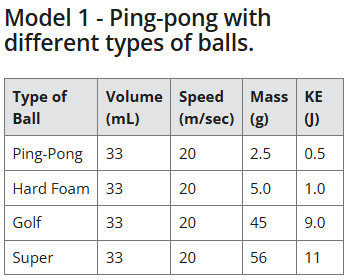
Type of Ball | Volume (mL) | Speed (m/sec) | Mass (g) | KE (J) |
|---|---|---|---|---|
Ping-Pong | 33 | 20 | 2.5 | 0.5 |
Hard Foam | 33 | 20 | 5.0 | 1.0 |
Golf | 33 | 20 | 45 | 9.0 |
Super | 33 | 20 | 56 | 11 |
Examine the Mass data in Model 1. How do the numbers change as you move from the top to the bottom of this column?
I must grade this.
Examine the Kinetic Energy (KE) data in Model 1. How do the numbers change as you move from the top to the bottom of this column?
I must grade this.
Variables: there are three types of variables in an experiment — control, independent variable, and dependent variable.
a.) The control(s) are variables that are maintained the same. Which two variables are controls in Model 1?
b.) The independent variable is the one that the experimenter changes in an experiment. It’s what you are testing to see how it affects something else. Which one is the independent variable?
c.) The dependent variable is what changes based on the independent variable. It’s what you measure in the experiment to see the results. Which one is the dependent variable?
Using the information from Model 1, complete the following statement about the relationship between the mass of the balls and the kinetic energy of each ball.
The players of the ping-pong game are hitting the balls so they travel the same speed. However, each ball they are hitting has a different mass. They learned from their measurements that as the mass of the balls increase, the kinetic energy of the ball will
You are parent of 5 year-old and 7 year-old boys who love baseball and playing ball. But their favorite place to play is in the house. You go to the store and are able to choose to buy one of two different types of balls.
Ball 1 | Ball 2 | |
|---|---|---|
Type of Ball | Wiffle Ball
| Baseball
|
Mass (g) | 20 g | 145 g |

Which ball would be best to use in the house?
Including the term "kinetic energy" in your answer, explain why the above (#7) is so.
I must grade this.
Create a line graph that displays the relationship between the mass and the kinetic energy of the balls from Model 1.
a.) Plot the dots using the data from Model 1.
b.) Connect the dots.
I must grade this.
Examine the graph you created in the previous question.
Choose the line that best matches the graph you drew.
Using the line graph you created, complete the table below by estimating how much kinetic energy each ball type would have - using the mass.
I must regrade this.
Type of Ball | Volume (mL) | Speed (m/sec) | Mass (g) | KE (J) |
|---|---|---|---|---|
Hard Foam | 33 | 20 | 15 | |
Solid Rubber | 33 | 20 | 35 |
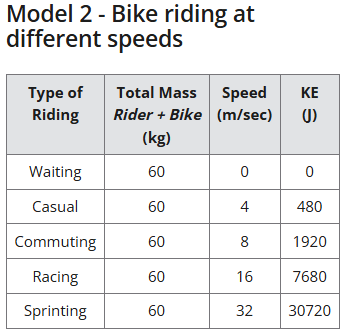
Type of Riding | Total Mass Rider + Bike (kg) | Speed (m/sec) | KE (J) |
|---|---|---|---|
Waiting | 60 | 0 | 0 |
Casual | 60 | 4 | 480 |
Commuting | 60 | 8 | 1920 |
Racing | 60 | 16 | 7680 |
Sprinting | 60 | 32 | 30720 |
Examine the speed data of Model 2. How do the numbers change as you move from the top to the bottom of the table?
Examine the kinetic energy data of Model 2. How do the numbers change as you move from the top to the bottom of the table?
Variables: there are three types of variables in an experiment — control, independent variable, and dependent variable.
a.) The control(s) are variables that are maintained the same. Which one variable is a control in Model 2?
b.) The independent variable is the one that the experimenter changes in an experiment. It’s what you are testing to see how it affects something else. Which one is the independent variable?
c.) The dependent variable is what changes based on the independent variable. It’s what you measure in the experiment to see the results. Which one is the dependent variable?
Using the information from Model 2, complete the following statement about the relationship between the speed of the bike riding and the kinetic energy of each.
On different days of the week, a bicyclist will ride differently. The bicyclist uses the same bike and he has the same mass. Therefore, as the speed of the bicyclist increases, the kinetic energy of the bike + rider system will...
I must grade this.
Create a line graph that displays the relationship between the speed and the kinetic energy of the bike + rider from Model 2.
a.) Plot the dots using the data from Model 1.
b.) Connect the dots.
I must grade this.
Examine the graph you created in the previous question.
Choose the line that best matches the graph you drew.
Using the data from the graph you created from Model 2, or the data from Model 2.
Explain why the following statement is true.
If an object is stationary (not moving), it has zero kinetic energy.
I must grade this.
Using the data from the graph you created from Model 2, or the data from Model 2.
Explain why the following statement is true.
It would hurt more to fall from a faster bicycle than from a slow bicycle.
I must grade this.
Using the graph you created from Model 2, complete the table below by estimating the kinetic energy of each type of riding - use the speed.
I must grade this.
Type of Riding | Total Mass Bike + Rider (kg) | Speed (m/sec) | KE (J) |
|---|---|---|---|
Uphill | 60 | 12 | |
Downhill | 60 | 24 |


Examine the data from Model 1 and Model 2 to determine what things can be changed to produce a change in kinetic energy.


Examine the data from Model 1 and Model 2.
Write a one-sentence statement that describes/defines kinetic energy.
I must grade this.
Examine Model 1. Identify two variables that are controlled (kept the same).
Examine Model 1. Identify one variable that can be changed by going to a store and buying different objects.
Examine Model 2. Identify one variable that are controlled (kept the same).
Examine Model 2. Identify one numerical variable that is changed.