Everything around us is composed of matter, which typically exists in one of three forms: solid, liquid, or gas. Water is one of the most prevalent substances we encounter. It can be transformed into ice to chill our beverages, used in its liquid form for drinking, hygiene, and plant sustenance, or turned into steam for cooking and deep cleaning. Additionally, we inhale water vapor present in the atmosphere.
In this activity, we will investigate how water reacts when we introduce heat energy (thermal energy) to it.

Time (min) | Temp (oC) | Time (min) | Temp (oC) | |
|---|---|---|---|---|
0 | -10 | -- | 5.0 | 80 |
0.5 | -5 | -- | 5.5 | 95 |
1.0 | 0 | -- | 6.0 | 100 |
1.5 | 0 | -- | 6.5 | 100 |
2.0 | 0 | -- | 7.0 | 100 |
2.5 | 5 | -- | 7.5 | 100 |
3.0 | 20 | -- | 8.0 | 100 |
3.5 | 35 | -- | 8.5 | 105 |
4.0 | 50 | -- | 9.0 | 115 |
4.5 | 65 | -- | 9.5 | 125 |
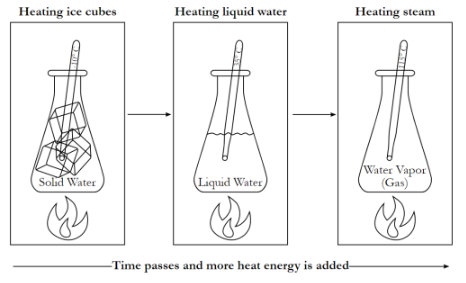
Look at the model above. What are the states of matter listed for water?
Circle the areas in each drawing where water is located in each flask.
In the model, what happens to the amount of heat energy as time increases?

Time (min) | Temp (oC) | Time (min) | Temp (oC) | |
|---|---|---|---|---|
0 | -10 | -- | 5.0 | 80 |
0.5 | -5 | -- | 5.5 | 95 |
1.0 | 0 | -- | 6.0 | 100 |
1.5 | 0 | -- | 6.5 | 100 |
2.0 | 0 | -- | 7.0 | 100 |
2.5 | 5 | -- | 7.5 | 100 |
3.0 | 20 | -- | 8.0 | 100 |
3.5 | 35 | -- | 8.5 | 105 |
4.0 | 50 | -- | 9.0 | 115 |
4.5 | 65 | -- | 9.5 | 125 |
In this model what happened to heat energy in the flask over time?
Label all of the temperatures in the table in which water is a solid, liquid, or gas. Use brackets, lines, and labels.
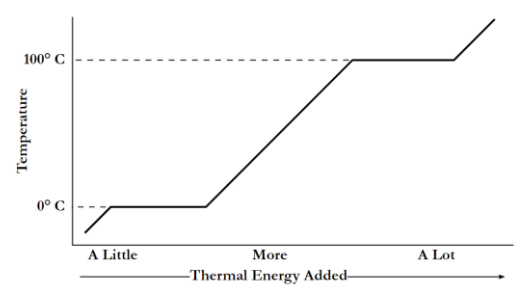
Create a line graph using the information in the data table.
In the hint, there are instructions for plotting and connecting dots on a line graph.
I must verify the correctness of this before you continue.


What specific variable is on the x-axis of both graphs in the model to the left?
What form of energy is added to the substance represented in graphs A and B?
What specific variable is included on the y-axis of graph A?
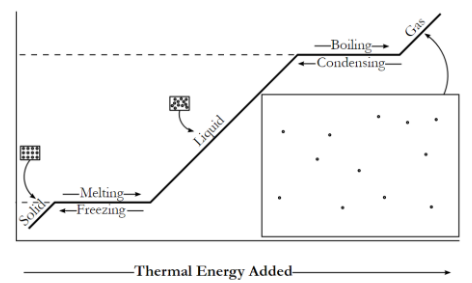
Add the label of y-axis on graph A onto graph B.
Add the numbers that are on the y-axis of graph A on graph B, in the same location as they appear on graph A.
Find the following on graph B - solid, liquid, gas, melting, freezing, boiling, condensing. Add them to graph A in the same locations as they appear on graph B.
You will be using the information on these graphs on some of the next questions; I must verify this before we move forward.
Do not attempt these until your graphs on #10 are verified as accurate by Mr. Poe.
Refer to the information on the graphs on Q10.
a.) The melting point of water is the temperature in which ice melts. What is this temperature?
b.) The boiling point of water is the temperature in which liquid water boils. What is this temperature?
Start in the bottom-left of each graph on Q10 and trace each line toward the upper-right. Pay attention for the following and identify the name for each:
c.) Water changing from liquid to gas as thermal energy is added.
d.) Water changing from solid to liquid as thermal energy is added.
e.) Water changing from gas into liquid as thermal energy is removed.
f.) Water changing from liquid to solid as thermal energy is removed.
Refer to the information on graphs A and B on Q10. Use some of the following words or phrases to help you answer the questions below:
increases; decreases; stays the same; freezes; melts; boils; condenses
g.) As thermal energy (heat) is added to solid water (ice), the temperature of the solid water
h.) During melting, the temperature of the ice
i.) Assume all the liquid water boils away into gas (water vapor), if you were to continue to add thermal energy (heat), the temperature of the gas
j.) When you decrease the thermal energy from a liquid, it
We have learned that as the temperature of a substance increases, the speed of its particles also increases and often the space between the particles also increases. The graph shown in Q10 and Q11 is a very specific type of diagram that shows the relationship between the amount of thermal energy added, the phase state of water, and the temperature of water. This type of diagram is referred to as a Heating Curve.

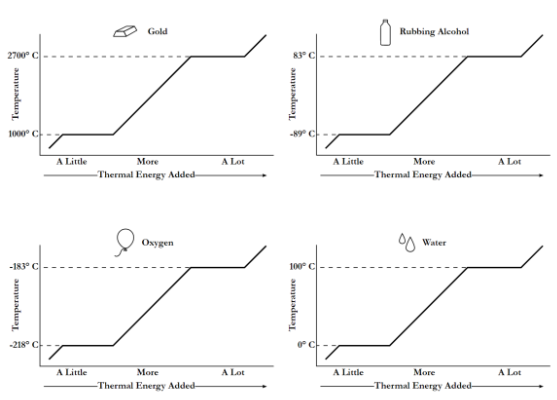
How many substances are represented in the graph to the left?
Create a heating curve for mercury (Hg).
You will have to look up the freezing/melting point and the boiling point for this substance in degrees Celsius.
Feel free to refer to other heat curves used in earlier parts of this activity as a reference.
The following must be included:
correct shape of the heating curve
label for x-axis and y-axis
labels where Hg is solid, liquid, and gas on the curve
label the melting and boiling points on the curve
labels for the changes of state - melting, freezing, boiling, condensing
Examine the heating curves to the left. Which four details are similar in each of them?
Examine the heating curves to the left. Which two details are dissimilar in each of them?