Twa kɔ nsɛm atitiriw so
Log in
Sign up for FREE
arrow_back
Laabri

Copy of 1.) Examining Wave Data (5/28/2026)

star
star
star
star
star
Last updated about 1 month ago
19 Nsɛmmisa
Hyɛ no nsow a efi ɔkyerɛwfo no hɔ:

To finish this, you need to scroll to the bottom of the review window and click, "Retake".

To finish this, you need to scroll to the bottom of the review window and click, "Retake".

1

Wave height - the distance between the top and bottom of a wave.

Crest - the very top of a wave.

Trough (pronounced, "troff") - the very bottom of a wave.

2
2
1
2
5

Model 1

1
Asemmisa {{asɛmmisaAhyɛnsode}}
1.

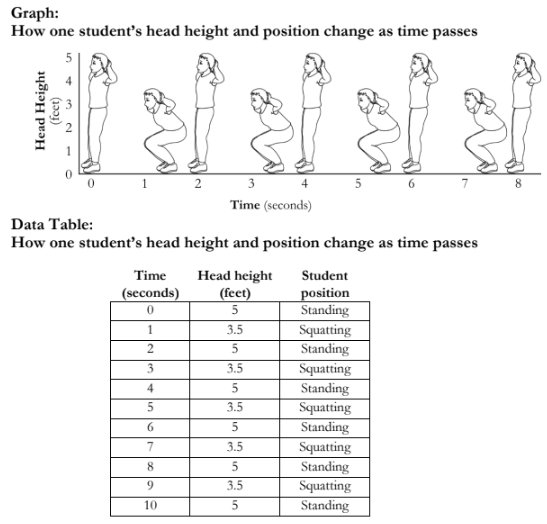
Examine the whole model, including the reading/descriptions.

How many people does the graph and data table collecting data from?

1
Asemmisa {{asɛmmisaAhyɛnsode}}
2.

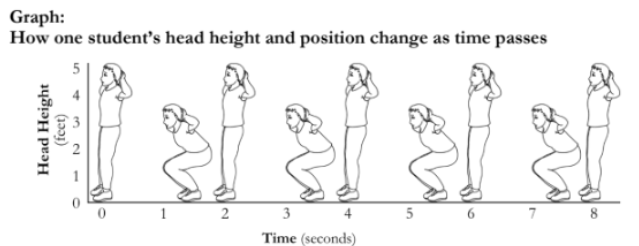
Examine the axes on the graph (not the data table).

What is the label of the x-axis?

What is the label of the y-axis?

1
Asemmisa {{asɛmmisaAhyɛnsode}}
3.

What does the graph (not the data table) display?

Model 1

3
Asemmisa {{asɛmmisaAhyɛnsode}}
4.

a.) What position was the student in when they were first observed?

b.) What was their head height when they were first observed?

c.) Find the student at 5 seconds; what position were they in?

d.) At 5 seconds, what was their head height?

e.) What would be the student's approximate head height when they were between standing and squatting at 2.5 sec?

1
Asemmisa {{asɛmmisaAhyɛnsode}}
5.

Explain how you determined your answer to 4e.

Alternatively, you can type out the math required to find this value.

2
Asemmisa {{asɛmmisaAhyɛnsode}}
6.

Compare and contrast the data table and graph.

Does it appear the data table and graph are displaying the same or different data?

Why do you think this?

1
1
Asemmisa {{asɛmmisaAhyɛnsode}}
8.

What is the maximum change in the student's head height in the data? Show your math.

Asemmisa {{asɛmmisaAhyɛnsode}}
9.

In the graph, add a smooth curved line that connects the top of the student's head at each position.

Model 1

Notice that the student shown in Model 1 did not move side-to-side or back-and-forth on the gym floor. While performing squats, the motion was strictly up and down. The graph showing how the student's head height changes over time reveals a consistent, repeating pattern. Scientists call this type of pattern a wave. The same word is also used to describe the rise and fall of water in the ocean. Now, let’s take a closer look at water waves. Do they behave in the same way as the waves we observed in Model 1?

1
Asemmisa {{asɛmmisaAhyɛnsode}}
10.

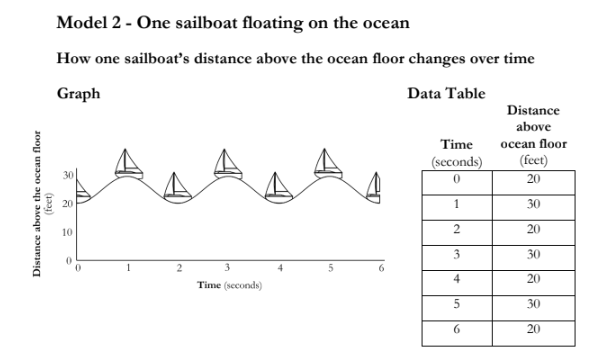
Looking at the model to the left, write one sentence that describes the information being displayed in the graph and the data table combined.

1
Asemmisa {{asɛmmisaAhyɛnsode}}
11.

Look closely at the x-axis label on the graph in Model 2. Describe how it compares to the x-axis label on the graph in Model 1.

1
Asemmisa {{asɛmmisaAhyɛnsode}}
12.

Look closely at the y-axis label on the graph in Model 2. Describe how it compares to the y-axis label on the graph in Model 1.

1
Asemmisa {{asɛmmisaAhyɛnsode}}
13.

The graph in model 2 displays data from how many sailboats?

2
Asemmisa {{asɛmmisaAhyɛnsode}}
14.

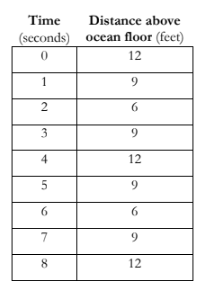
To make the Model 2 graph, an observer noted each moment when the sailboat was at its lowest point near the ocean floor and at its highest point away from it.

a.) What was the sailboat’s distance above the ocean floor during the first observation?

b.) What was the sailboat’s distance above the ocean floor at time = 1 second?

c.) Calculate the biggest (maximum) change in the sailboat’s distance above the ocean floor as it floats in the water. Show your math.

d.) If the sailboat sank to the bottom of the sea. What would be its distance above the ocean floor?

Asemmisa {{asɛmmisaAhyɛnsode}}
15.

Wave height - the distance between the top and bottom of a wave.

Crest - the very top of a wave.

Trough (pronounced, "troff") - the very bottom of a wave.

  1. Label one crest and trough.

  2. Draw a vertical, dashed, double-arrowed line to display the distance between one crest and its nearest trough - label this as "wave height" on this line.

Stop - do not go past this point (I'll delete anything you do).

MUTCD Stop Sign

Asemmisa {{asɛmmisaAhyɛnsode}}
16.

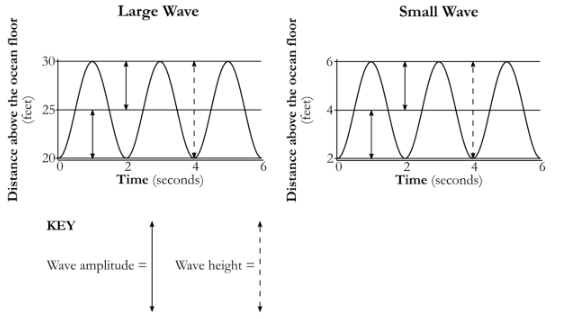
Examine the two waves displayed below.

Notice:

  • amplitude is used in this question.

  • the presence of a similar line that you were to draw and label in question 15.

Also notice that each graph contains some features that were absent in the prior one.

  • the long horizontal line at the mid-point of the graph.

  • vertical arrows from the mid-point to either the top or bottom of the graph.

a.) Based upon the two graphs, above, fill-in the needed information in the table, below.
Type of Wave

Wave Height

(feet)

Wave Amplitude

(feet)

Small

Large

Asemmisa {{asɛmmisaAhyɛnsode}}
17.

If you knew the wave height, how could you find the wave amplitude?

Asemmisa {{asɛmmisaAhyɛnsode}}
18.

Take what you stated in question 17 and use it to complete the following table:

Don't forget the corresponding units for each blank.

Wave Height

Wave Amplitude

10 feet

10 meters

4 centimeters

600 inches

Asemmisa {{asɛmmisaAhyɛnsode}}
19.

Use the information in the data table to create a graph that compares the distance above the ocean floor versus time.

  • Be sure to label the axes of the graph using the titles of each column of the table.

Recommendation - plot the dots then connect them with a line.

Asemmisa {{asɛmmisaAhyɛnsode}}
7.

Examine the data table and graph.

Attempt to identify the pattern in head height and student position over time.

Which of these best describes the pattern observed (select all that apply).