Copy of 4.) Virtual Lab - Waves Properties (5/28/2026)
Water Waves - Amplitude:
In the simulation below, select, "Water."
Click on "Graph" in the upper-right.
Set the Frequency to the lowest setting.
Set the Amplitude to the lowest setting.
Examine the image below; notice along the x-axis each line is equivalent to 1 cm and that each line along the y-axis is also equivalent to 1 cm.
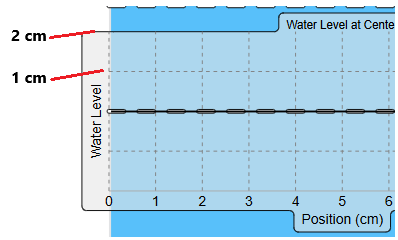
In this section, you will be using water waves to examine the following wave properties - wavelength, frequency, and amplitude.
You will first adjust the amplitude (without changing the frequency), slowly increasing it from 0 to max (increase it each small line every 10 seconds) while you are examining how the height of the wave changes.
After that, you will set the amplitude to the middle setting (between 0 and max); then you will increase the frequency setting in following the same procedure for increasing the amplitude in the prior instruction.