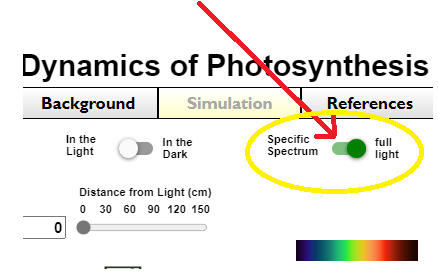
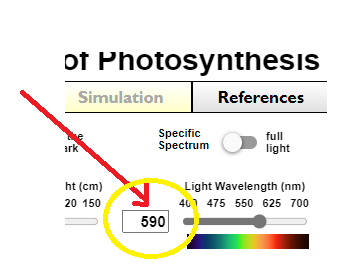
Ideas that we will explore in this lab:
Since oxygen gas is produced in the first stage of photosynthesis, the light reactions, if a chloroplast is performing photosynthesis, then it is reasonable to assume that it will give off oxygen gas as a byproduct.
The amount of the gas (oxygen) that is produced changes based upon the rate of photosynthesis that is occuring - the greater the rate, the more oxygen is given off, vice-a-versa.
Therefore, if all of this is true (and it is), we should be able to measure the rate of photosynthesis by measuring the amount of oxygen that is given off by the chloroplast.
Next, we will also measure how changing the amount and intensity of light and different wavelengths of light will have on the rate of oxygen production and the rate of photosynthesis.
The primary assumption that we are using in this lab is that if oxygen production is high then the rate of photosynthesis is high; and if oxygen production is low then the rate of photosynthesis is low (this is a directly proportional relationship).
Questions:
Can we measure the rate of photosynthesis by measuring the amount of oxygen gas that is given off by the choloroplast?
How does changing conditions (light intensity, temperature, and carbon dioxide concentration) affect photosynthesis rates?
Which wavelength of visible light (ROY G BIV) is absorbed or reflected the most of the chloroplast?
Instructions:
Click the orange "start simulation" button.
On the graph to the bottom-right, you will see four tabs across the top of it - ATP, Glucose, NADPH, Oxygen - we will only be measuring oxygen production. Therefore, click the "oxygen" tab (be sure that this tab is open for each step of this lab).
Variables that we will NOT change at any point in this lab - Initial pH of Stroma, added NADPH, Atrazine.
You can think of light intensity as the distance from a light source - the closer something is to the light source, the more intense the light, etc. We will be adjusting the "Distance from Light (cm)" to measure the impact of changing the intensity of light on the rate of photosynthesis by measuring the amount of oxygen produced.
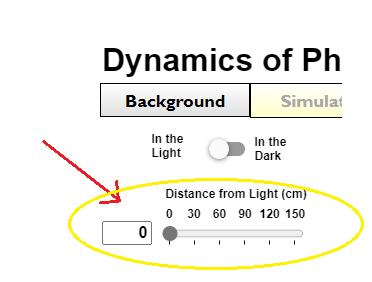
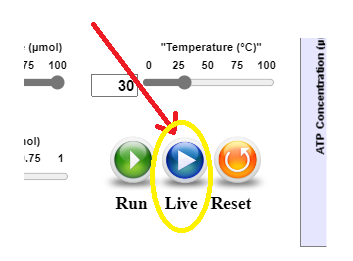
Begin with 0 cm, then click the blue "live" buttom at the bottom of the lab.
Record the amount of oxygen produced after 30 minutes (look at the bottom of the graph to find the time).
Repeat this process, increasing the distance from light by 5 cm for each trial. Continue do this, recording the oxygen produced at 30 minutes, until it reads "0" or until you reach 100 cm.
Record your data on the data table on the provided Google sheet (https://docs.google.com/spreadsheets/d/10O5-dXJOUI-CQOSsmvcBusKY0WpQlOeuN6JecMeS8h0/edit?usp=sharing) - make a copy of it (click, "file" and then "make a copy") and add your name to the title.
Create two line graphs from your lab data. The first graph should use the data from Part 1 and the second graph should use the data from Part 2. If you do not know how to do this, watch the video, posted below.
Copy and paste each line graph where appropriate, below.
Answer the post-lab questions, below (on Monday).
Part 1 Graph
Use a smooth-line graph.
Change title of the graph to, "Part 1 - Light Intensity vs. Oxygen Production.
Add 4 minor gridlines to the vertical and horizontal axes.
Part 2 Graph
Use a smooth-line graph.
Change title of the graph to, "Part 2 - Wavelength of Light vs. Oxygen Production"
Add 4 minor gridlines to the vertical and horizontal axes.
Attach your line graph with the Part 1 data, here.
Attach your line graph with the Part 2 data, here.
What are the two products of photosynthesis?
In this lab, we used the rate of oxygen production to indicate the rate of
If oxygen production is high, the rate of photosynthesis is
In part 1, at what point is photosynthesis the highest?
Cite your data - for the above question, how do you know?
In part 1, at what point is photosynthesis the lowest?
Cite your data - for the above question, how do you know?
According to your data, what happened to the production of oxygen at different light intensities?
In a chloroplast, only light that is absorbed will result in photosynthesis. From this lab, how do you know if a specific wavelength of light was absorbed well by the chloroplast?
In part 2 - use your data: were all wavelengths of light absorbed well by the chloroplast? How do you know?
From part 2 - what specific wavelengths were absorbed the best?
Use your data - photosynthesis is the conversion of carbon dioxide and water into glucose and oxygen by using light energy to drive the reactions in the chloroplast. If a plant is exposed to light, will it always perform photosynthesis at a high rate? How do you know? In your answer, explain how your data supports your ideas.