Using the diagram, annotate where erosion and deposition happen in a meandering river. Label the cut banks and point bars, and draw arrows to show the direction the meander is likely to migrate over time.
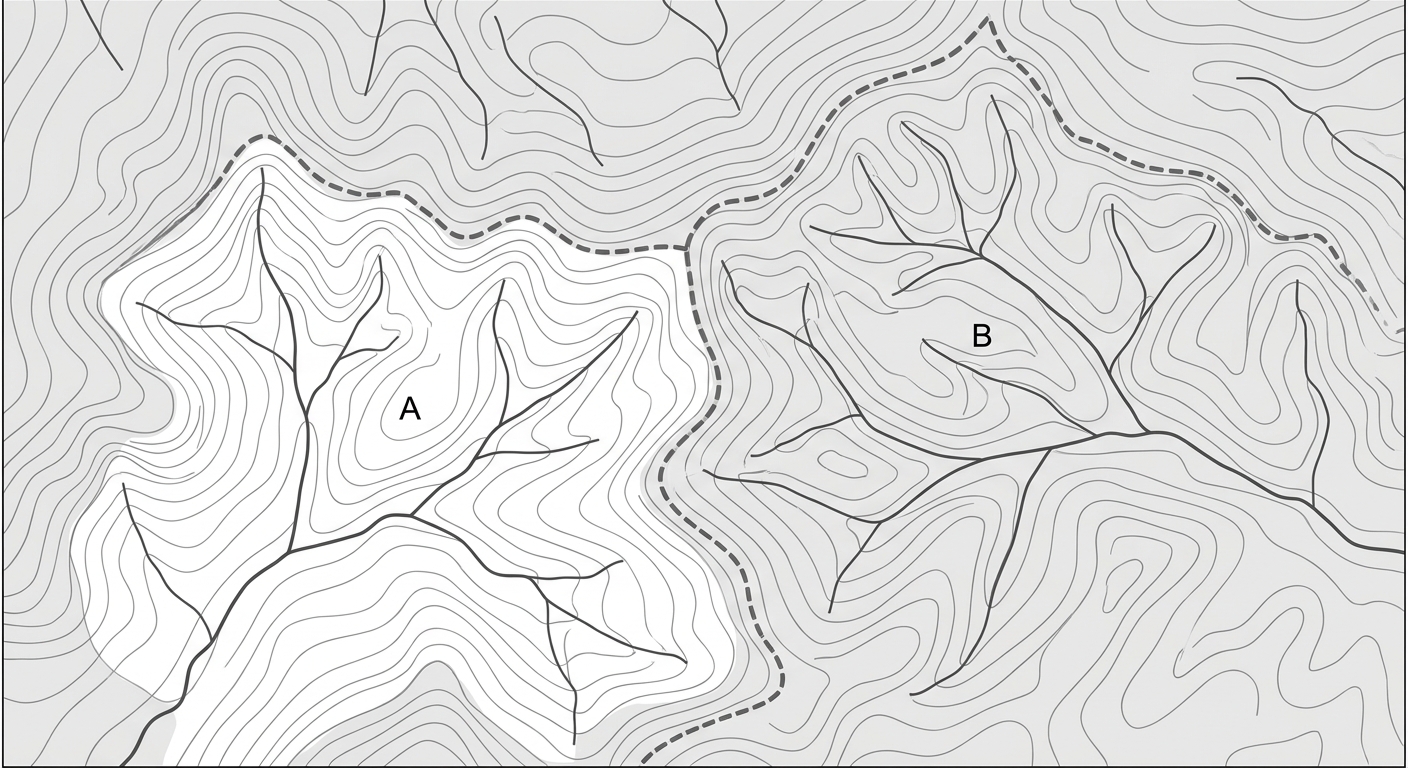
Trace the watershed boundary (drainage divide) on the map. Then draw arrows showing where runoff from two different points would flow to reach the main river.
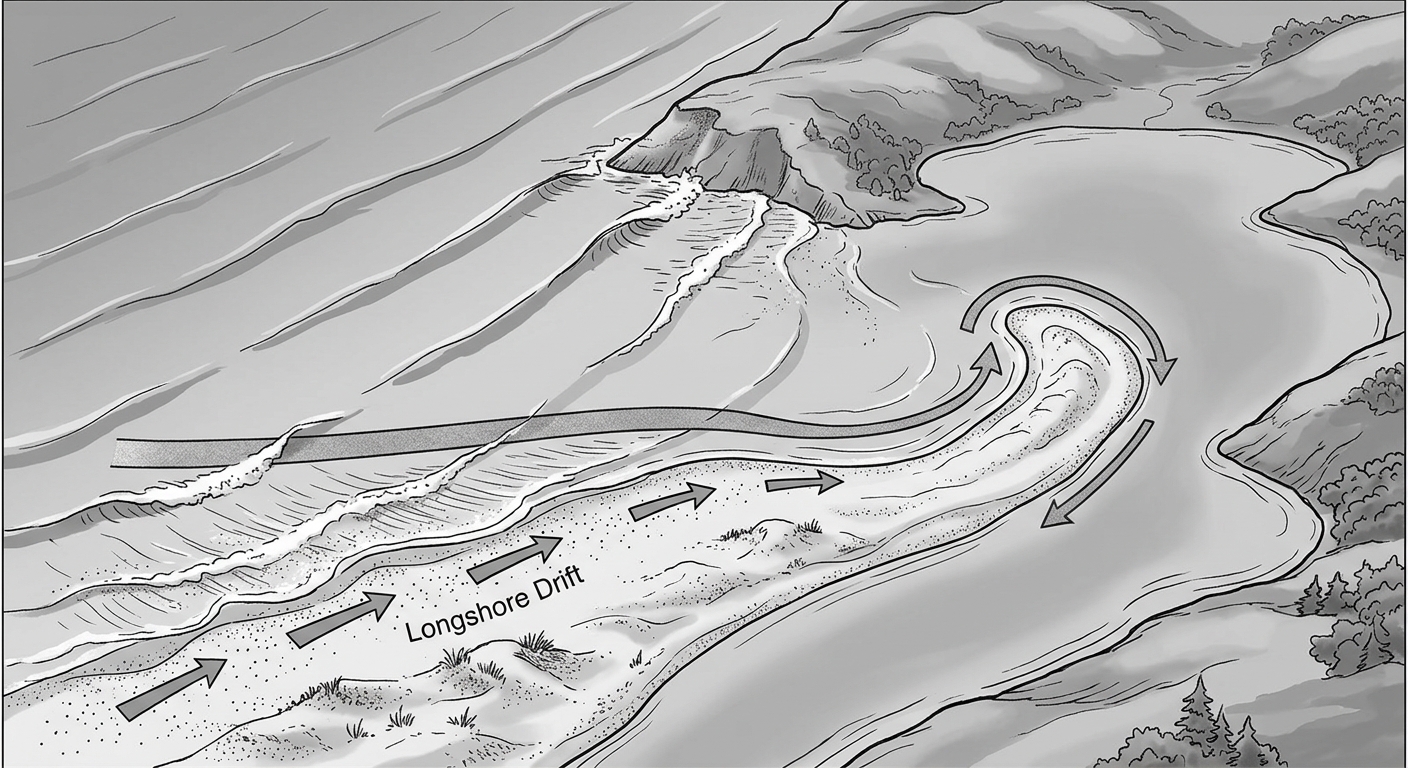
On the coastline diagram, annotate the direction of longshore drift and show where sand will likely be deposited. Draw the most likely growth direction of the spit.
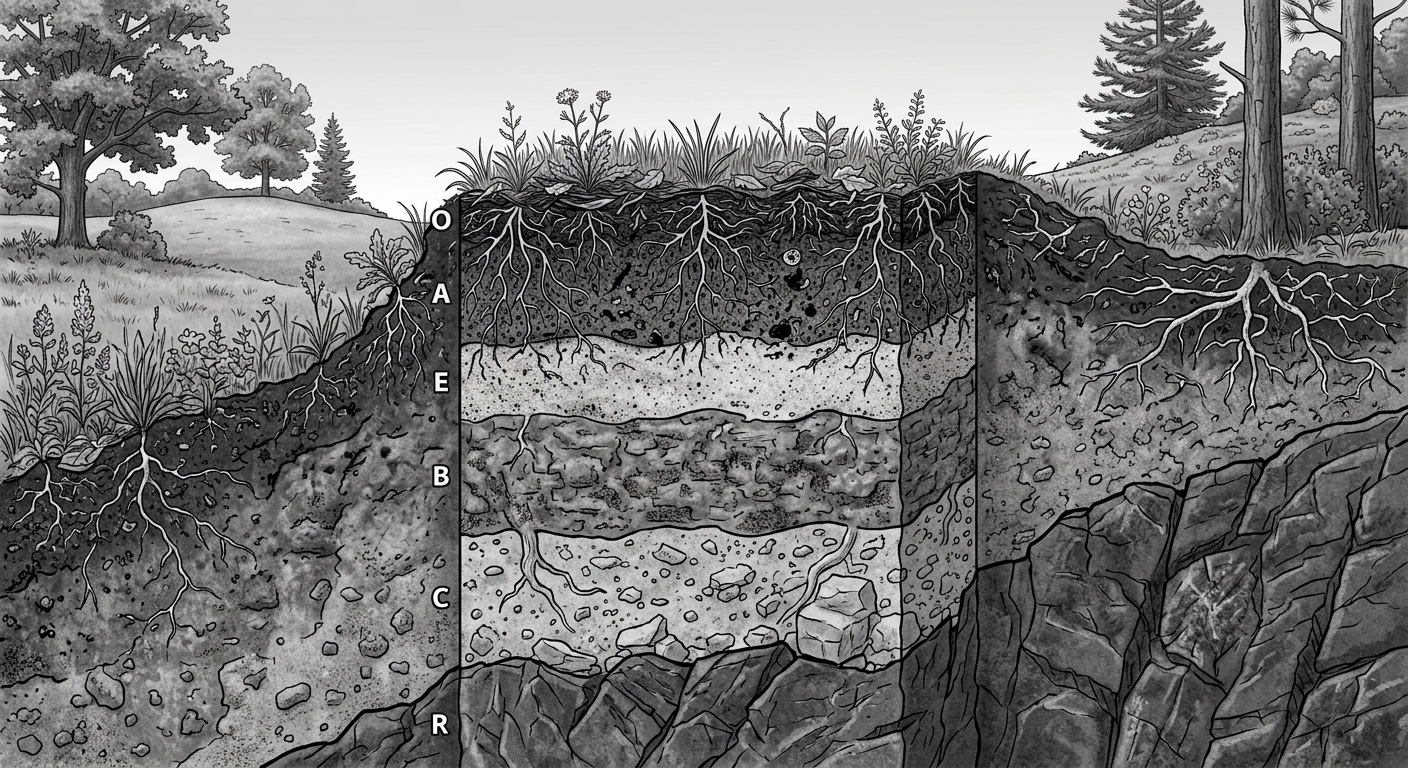
Label the soil horizons shown in the profile (O, A, E, B, C). Then circle the layer where weathering of parent material is strongest and add a short note explaining why.
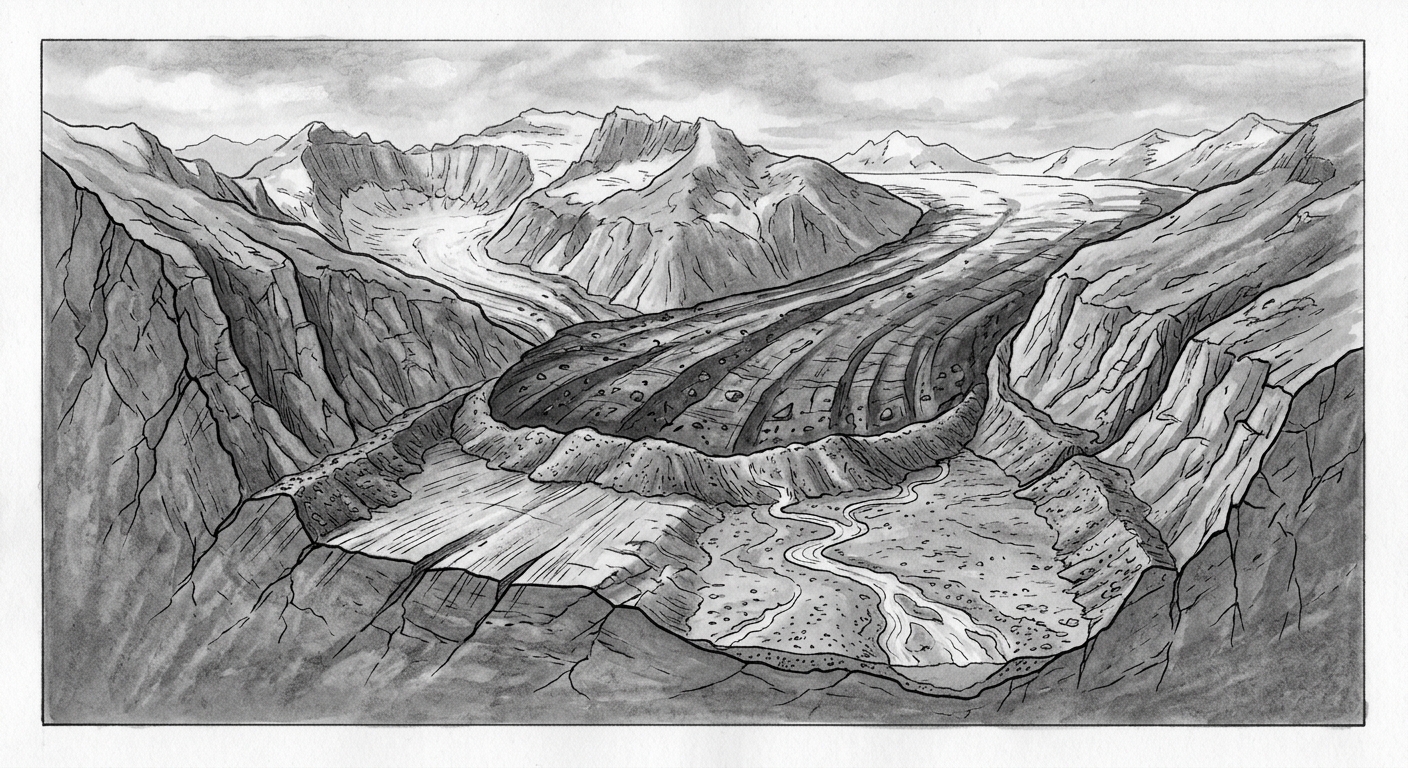
Annotate the glacial diagram by labeling at least three erosion or deposition features (for example: U-shaped valley, moraines, striations). Then draw arrows to show how ice movement creates those features.
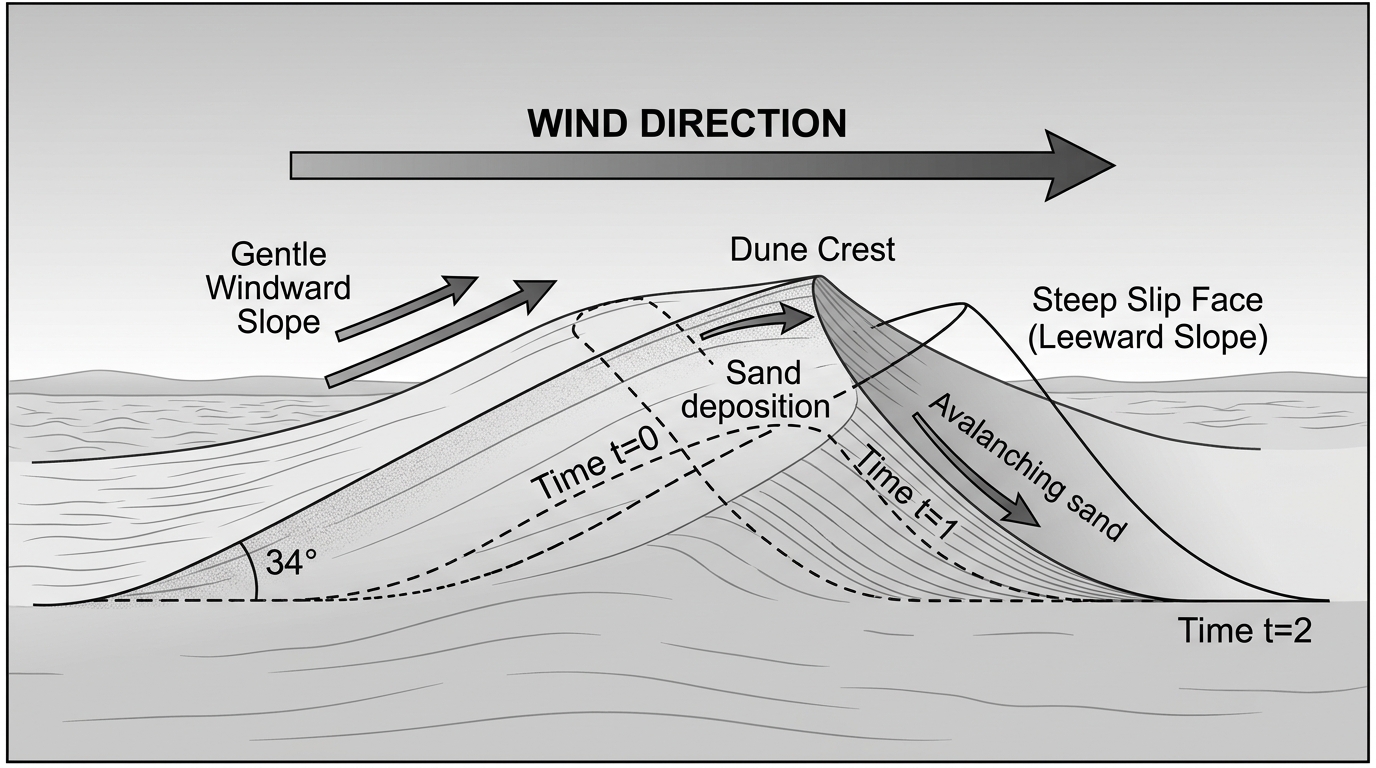
On the dune diagram, label the windward slope and slip face. Draw arrows for wind direction and show (with a dashed outline) how the dune will likely move over time.
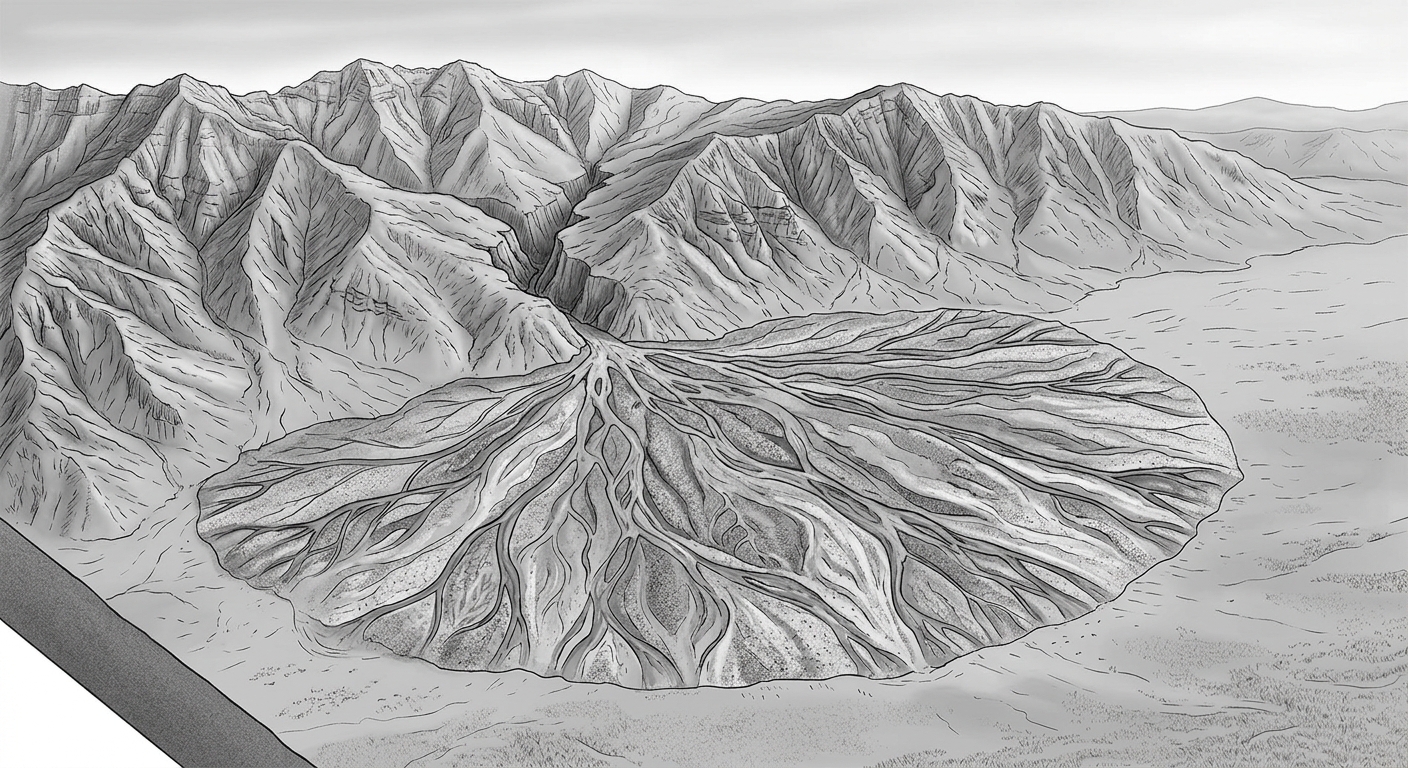
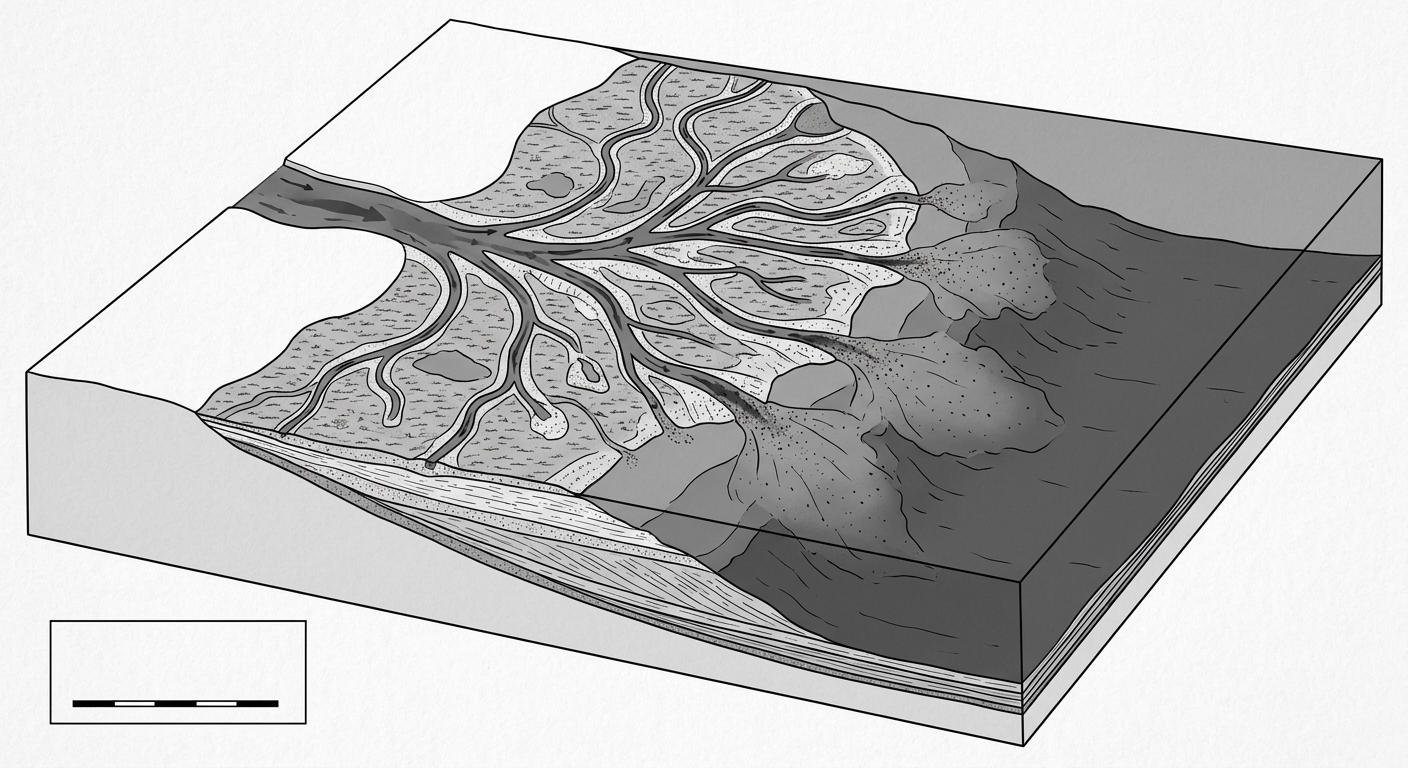
On the alluvial fan diagram, label where deposition is greatest and where sediments are likely to be coarser vs finer. Draw the most likely path of a flash flood as it leaves the canyon.
Annotate the delta diagram by labeling distributary channels and the main area of sediment deposition. Then draw arrows to show how sediment is transported and where it settles as water velocity decreases.
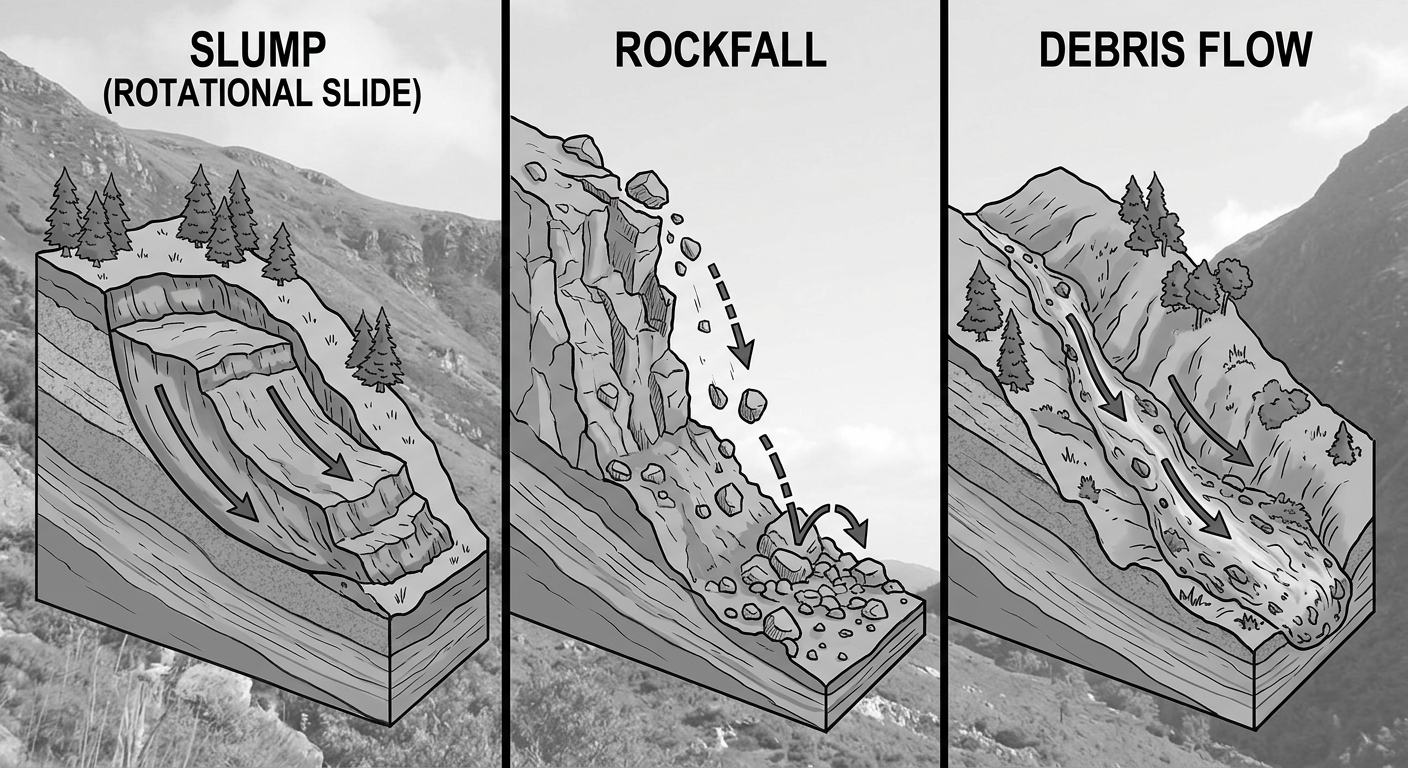
For each landslide panel, annotate what triggered the movement (water, over-steepening, gravity, etc.) and draw arrows to show the direction of motion. Then rank the three panels from fastest to slowest movement and justify with a brief note.
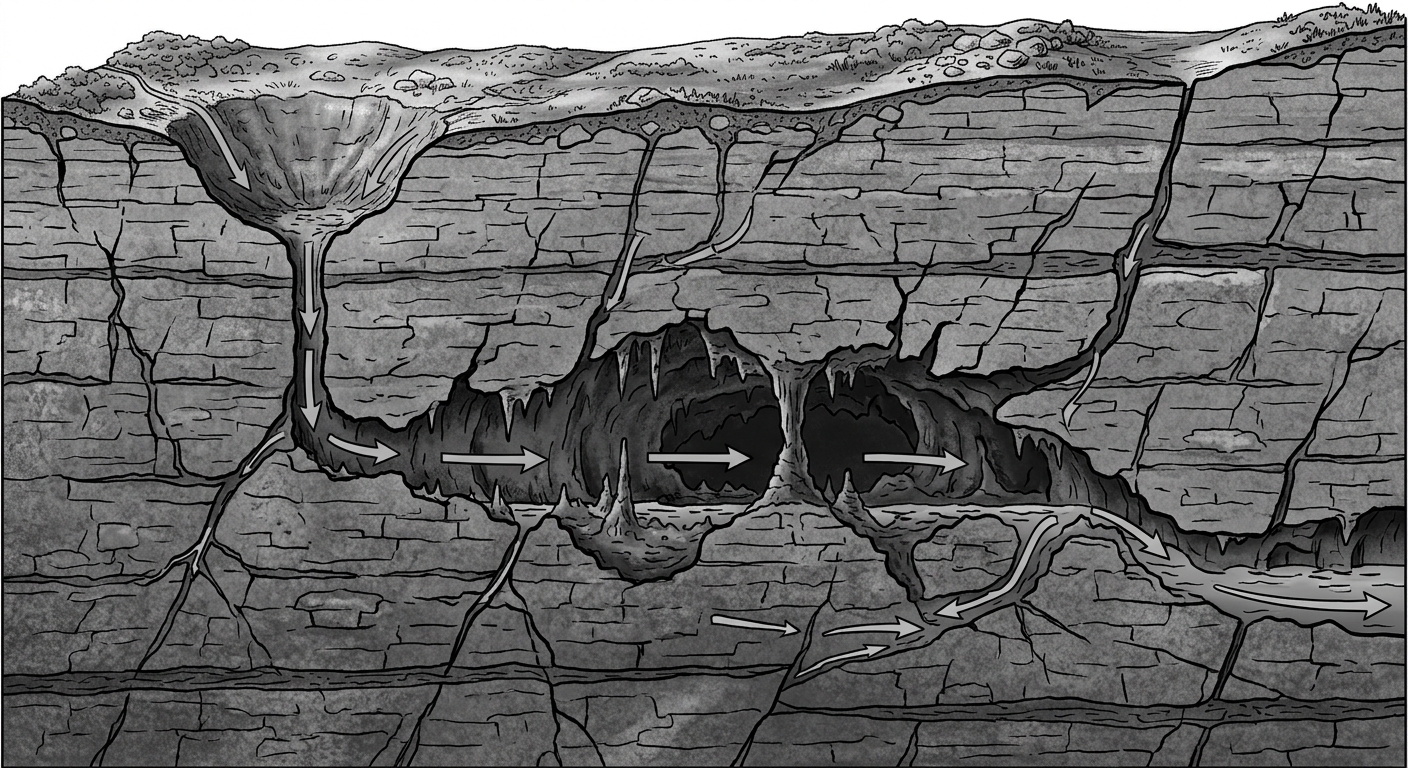
Annotate the karst cross-section by circling where chemical weathering (dissolution) is happening. Draw arrows showing groundwater flow paths and label where a sinkhole is most likely to form next.
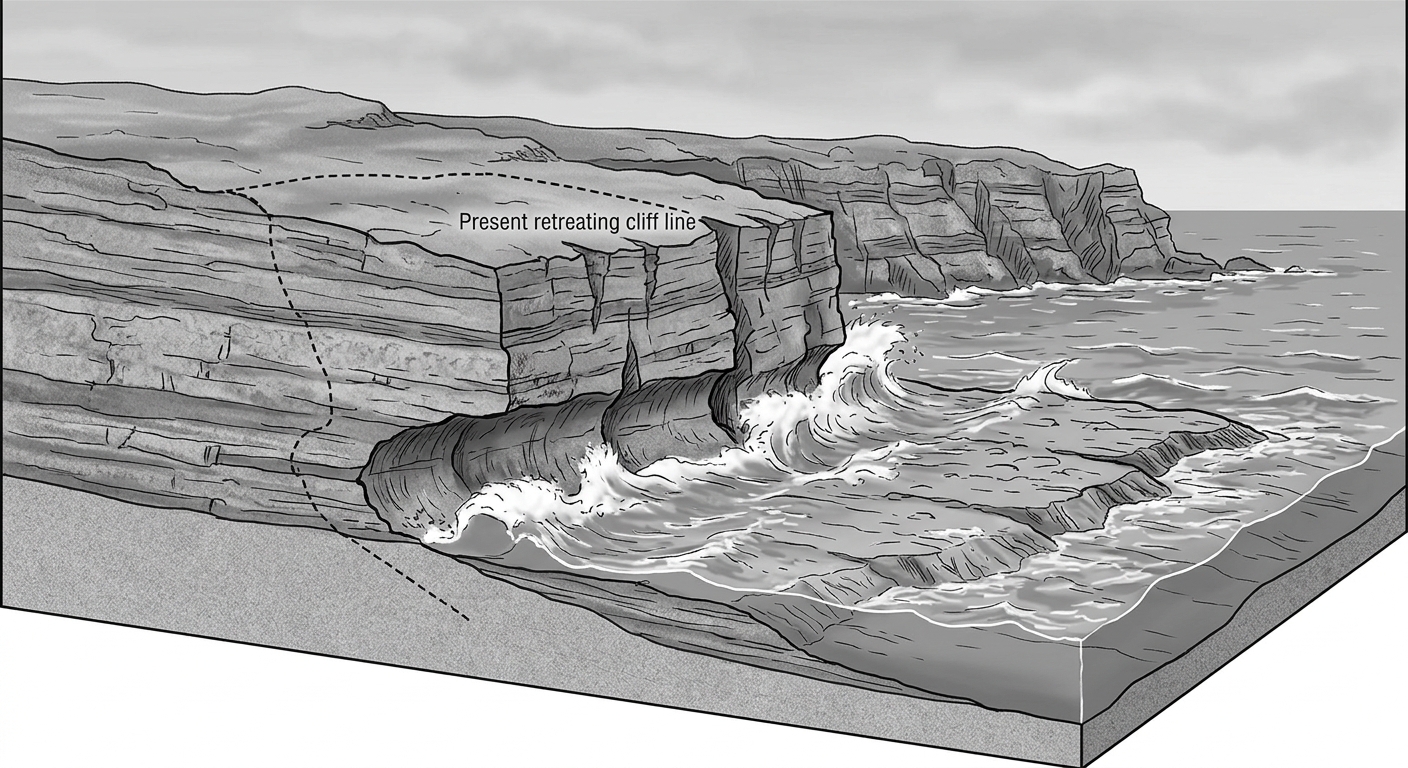
On the sea cliff diagram, label the wave-cut notch and wave-cut platform. Then draw arrows to show how wave energy causes cliff retreat over time and sketch the likely future cliff position.
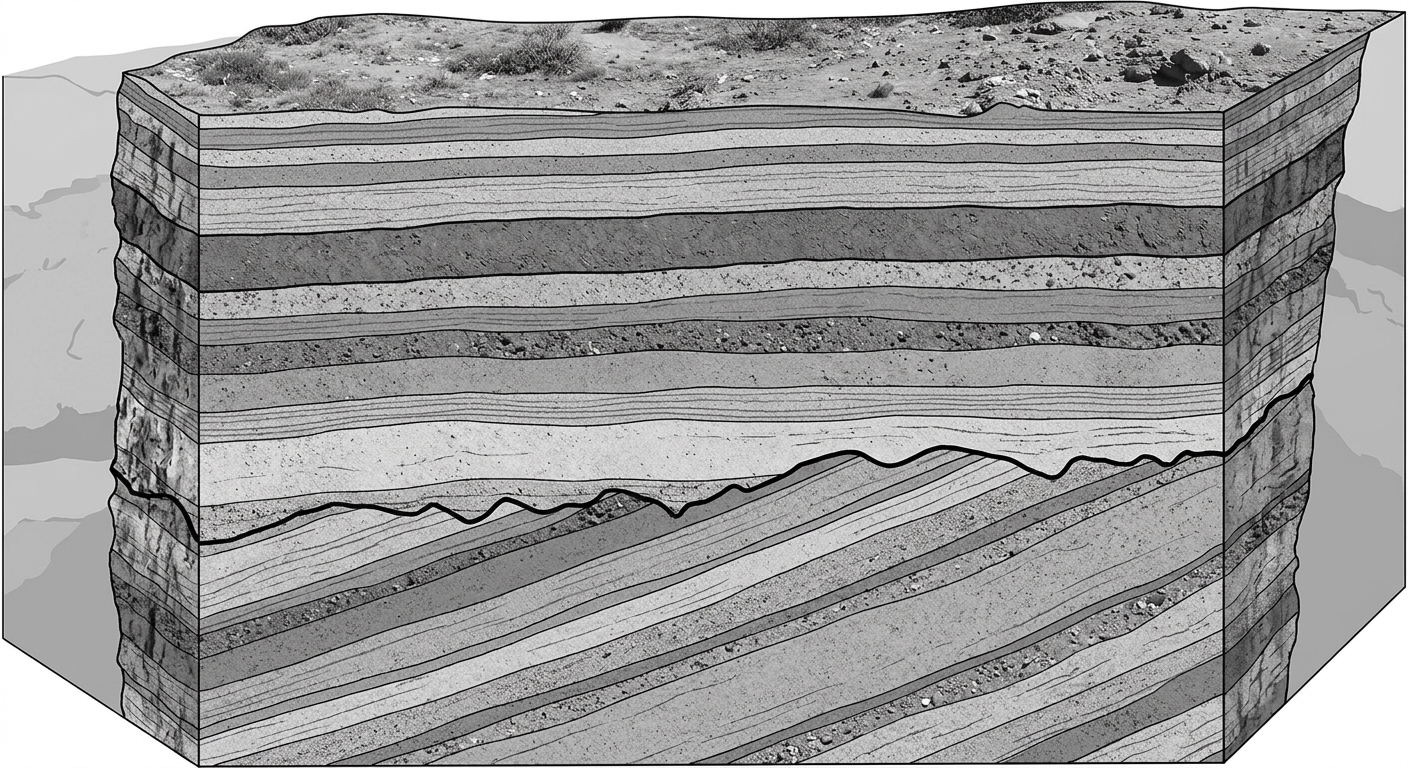
Using the layered ash/sediment diagram, correlate at least one matching layer across the exposure (draw lines). Identify the erosional surface and explain what process likely caused it.
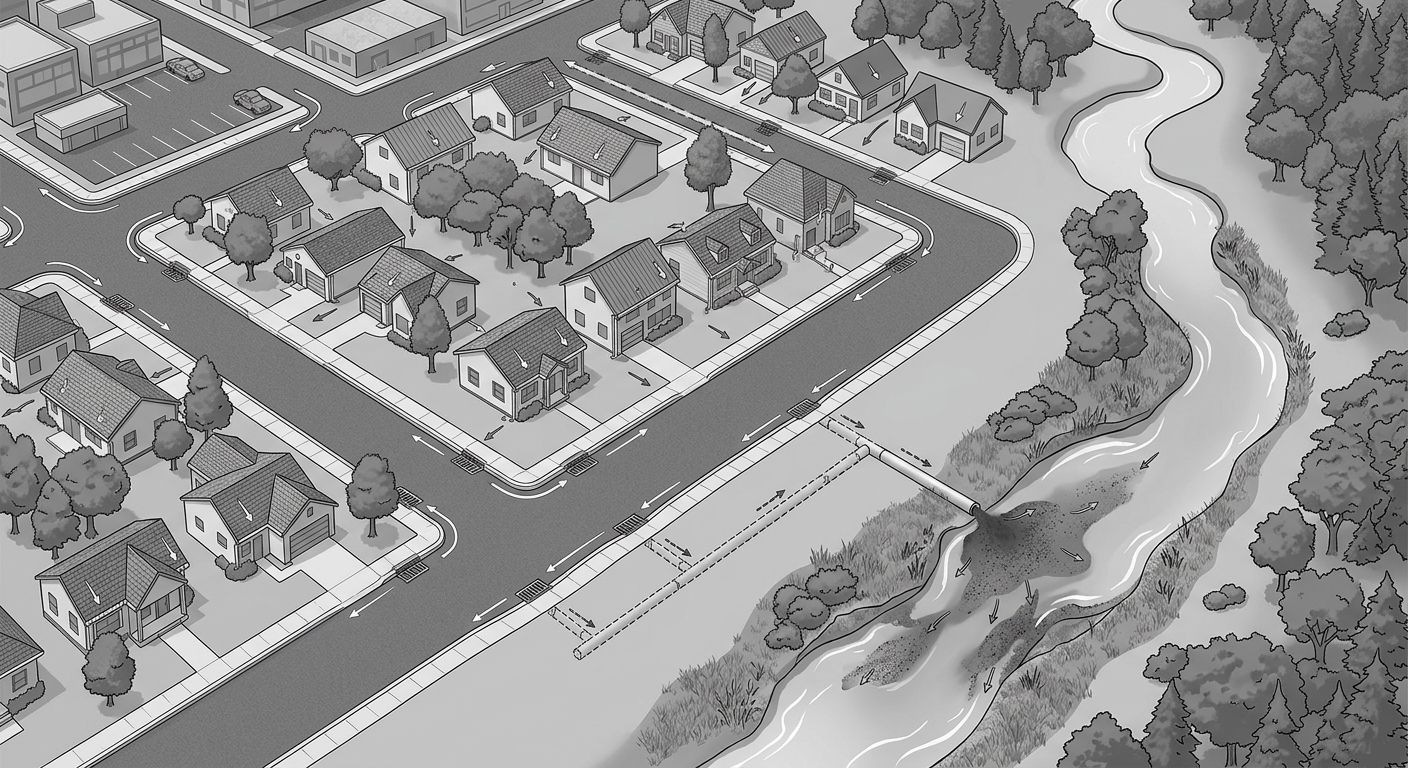
Annotate the urban runoff diagram by circling impermeable surfaces and drawing arrows for runoff paths into the stream. Then mark one place where erosion/sediment is likely to increase and one place where it could be reduced with a design change.
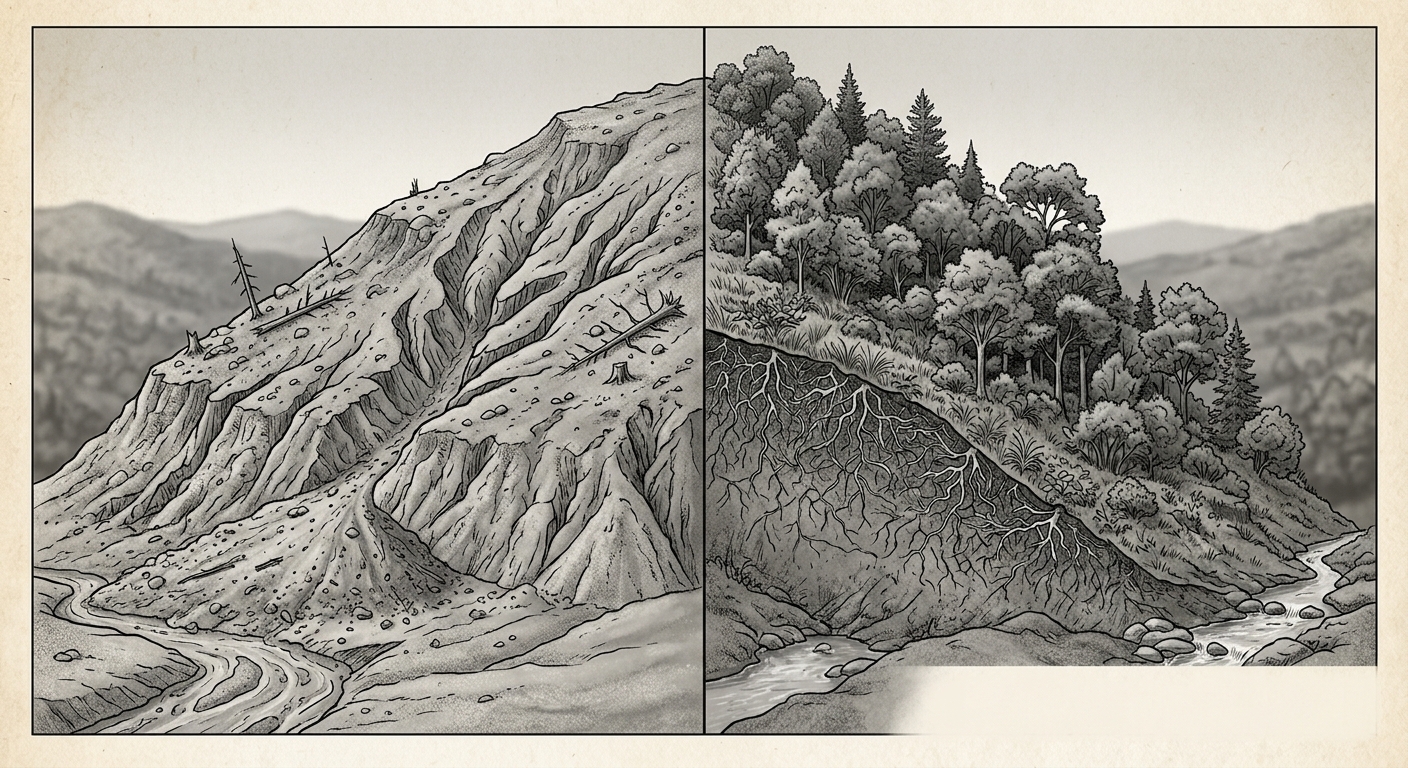
Compare the two hillslopes: annotate at least two erosion features on the deforested slope and at least two erosion-control features on the vegetated slope. Then draw arrows showing where sediment ends up in each case.
Compare the two hillslopes: annotate at least two erosion features on the deforested slope and at least two erosion-control features on the vegetated slope. Then draw arrows showing where sediment ends up in each case.
Use the river image below. Label the outside bend (cut bank) and the inside bend (point bar). Then add:
Erosion labels where the river is removing sediment
Deposition labels where sediment is building up Finally, draw arrows to show the general direction of water flow through the bend.