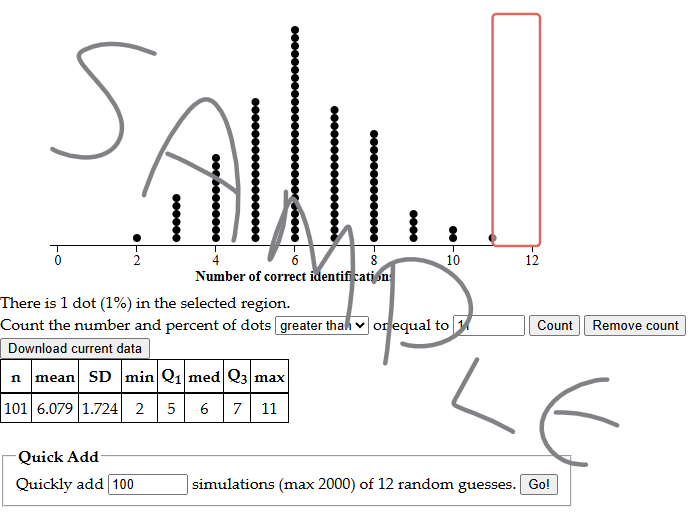
Take a screenshot of your dotplot and everything below it and upload it below.
It should look like this:
This formative digitizes the Unit 1, Part I introduction handout. Complete the definitions and respond to the activity reflection questions based on your class results.
How many correct guesses did you make on your first attempt?
Right under the dotplot is a sentence that starts with "Count the..."
Adjust the sentence to read: "Count the number and percent of dots greater than or equal to 11." Then click "Count".
How often were 11 or more shirts correctly identified by chance alone? Enter your percentage as a whole number between 0 and 100.
Statistical problem-solving process (the “four steps”):
What are the four statistical practices in AP® Statistics? Enter them as a comma separated list
Based on the class results, which seems more believable: Joy is just a lucky guesser, or Joy really can smell Parkinson’s disease? Explain your reasoning.
Take a screenshot of your dotplot and everything below it and upload it below.
It should look like this:
Based on your result and the results of the simulation, which seems more believable: Joy is just a lucky guesser, or Joy really can smell Parkinson’s disease? Explain your reasoning using complete sentences and evidence from your simulation.