Population Density
Population Density
Death (mortality)
Lack of resources
Emigration
Overproduction of resources
Birth (natality)
Immigration
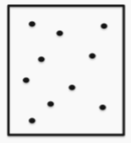
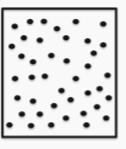
High Population Density
Low Population Density
Use the video or this PowerPoint link to take notes: Concept 3 Notes - Population Ecology.pptx
Use the video or this PowerPoint link to take notes: Concept 3 Notes - Population Ecology.pptx
| Draggable item | arrow_right_alt | Corresponding Item |
|---|---|---|
dependent factor | arrow_right_alt | has NO affect |
independent factor | arrow_right_alt | DOES have an affect |
Population Density
Death (mortality)
Lack of resources
Emigration
Overproduction of resources
Birth (natality)
Immigration
High Population Density
Low Population Density
Select the line on the graph that represents:
Type I: Late loss; heavy parental care
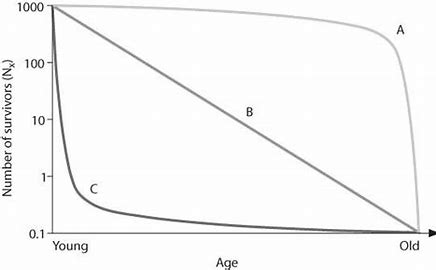
Select the line on the graph that represents:
Type II: Constant loss; mortality unaffected by age
Select the line on the graph that represents:
Type III: Early loss; produce lots of offspring at once and many die right away
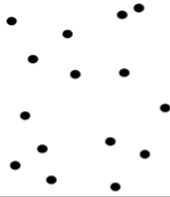
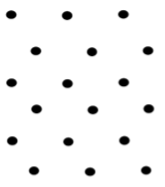
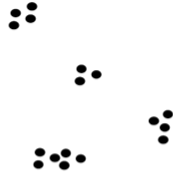
Dispersion = the spatial distribution of organisms in a population.
Match the correct type of dispersion with the visual below.
| Draggable item | arrow_right_alt | Corresponding Item |
|---|---|---|
uniform | arrow_right_alt | |
clumped | arrow_right_alt | |
random | arrow_right_alt |
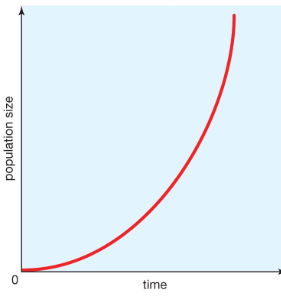
Unlimited growth
Extreme growth followed by slow growth
example: Human population
example: animal populations
Exponential Growth
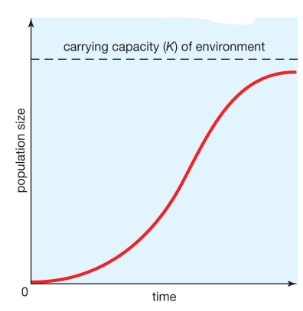
Logistic Growth
Limiting factors = Aspects of the environment that limit the size a population can reach.
Limiting factors can be biotic or abiotic
living
nonliving
competition
predation
climate
hurricanes
Abiotic
Biotic
Limiting Factors
example: drought
definition: regulates all populations (size doesn't matter)
example: availability of food
example: competition
definition: has a large impact on dense populations (size does matter)
Density-Dependent
Density-Independent
The graph below shows information about the growth of a population.
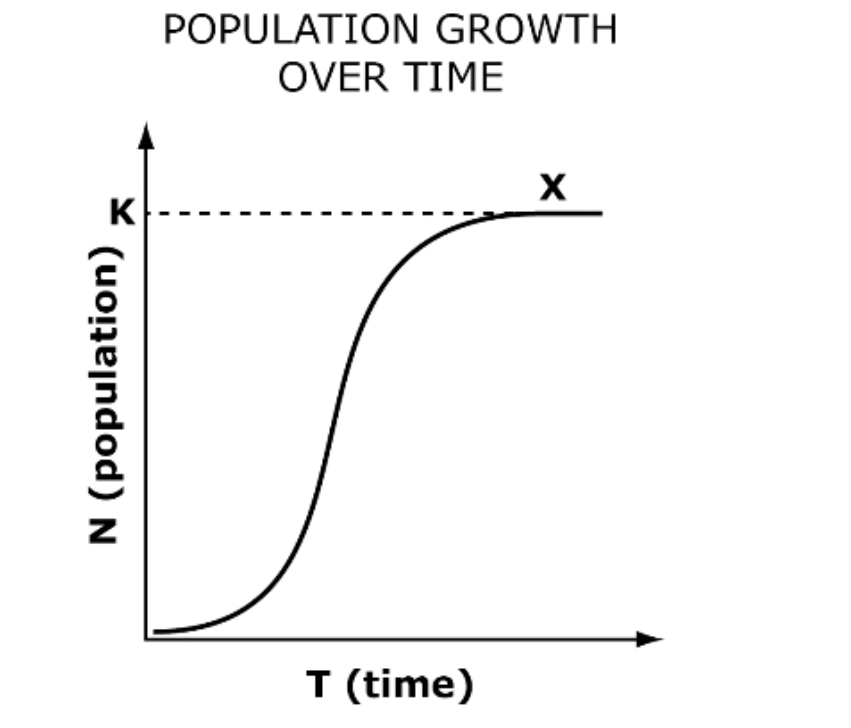
Which best explains what occurred at point X on the curve?
The graph shows the populations of two species of ants. Ants of species 2 have a thicker outer covering that helps prevent excessive evaporation of water and keeps them cool and hydrated.
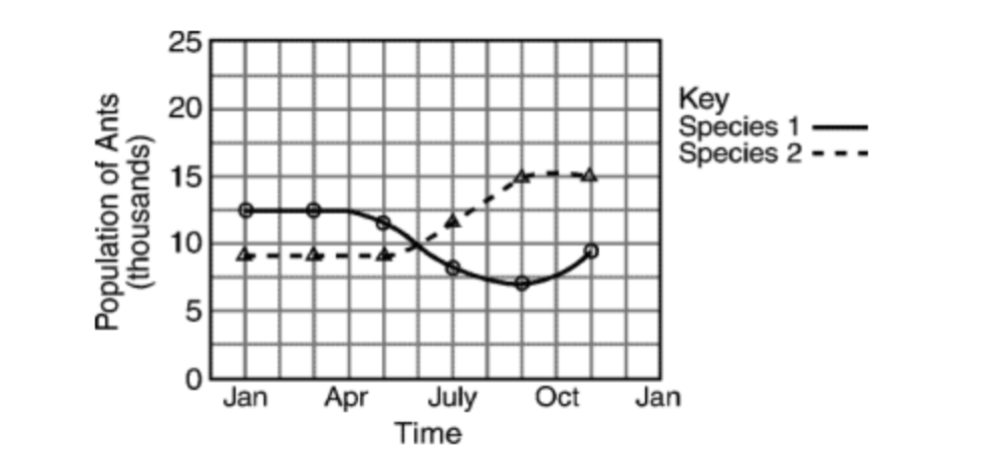
Which statement would best explain the population changes in the graph?
In the 1930s, the Red Imported Fire Ant was accidentally introduced into the United States. This species is native to South America, but has thrived in the United States because of a lack of natural enemies here. Which of the following best explains how the Red Imported Fire Ant has affected native ant species in the U.S. that do have predators?
Scientists that study the effects of global warming predict that a change in Earth's average temperature of even a few degrees will have dramatic effects. One consequence of global warming is the melting of the polar ice caps, which will in turn affect polar bears that use sea ice as a platform for hunting seals. What will most likely happen to the population of polar bears as a result of global warming?
Use your Population Ecology notes:
The rise and fall cycle of predation is a density-limiting factor because is DOES have an effect. For example, if more prey are eaten by the predators, the prey population would decrease. On the other hand, if the population of the predator decrease, the population of the prey would increase.
Draw a line on the graph that represents:
The deer population increases until it reaches the carrying capacity of 80 deer. This is a logistic graph.
Be sure the carrying capacity is labeled at the correct position.
Label the carrying capacity as 80 deer.
Draw a line on the graph that represents:
Part A: Exponential growth of the deer population
Part B: Population exceeds the carrying capacity
Part C: There is not enough resources to stabilize the population so the size decreases dramatically
Part D: The population recovers and stabilizes below the maximum capacity
Label parts A-D on the graph accordingly. Be sure the carrying capacity is labeled correctly.