Twa kɔ nsɛm atitiriw so
Log in
Sign up for FREE
arrow_back
Laabri

Statistics Unit Test B Fields

star
star
star
star
star
Last updated about 2 hours ago
23 Nsɛmmisa

Statistic Definitions

Mean (Average): sum of all values in a data set divided by the number of data values

Median / Second Quartile / 50th Percentile: middle value in a data set

Mode: value or values that occur most often in a data set

Minimum: least value in a data set

Maximum: greatest value in a data set

Range: difference of the greatest value and the least value (maximum minus minimum)

Deviation: distance a value is from the mean of a data set

Variance: mean of squared deviations

Standard Deviation: measure of how much a typical value in a data set differs from the mean

First Quartile (Q1) / 25th Percentile: the middle value of the lower half of a data set

Third Quartile (Q3) / 75th Percentile: the middle value of the upper half of a data set

Interquartile Range: difference of the third quartile and the first quartile (Q3 minus Q1)

Five-Number Summary: values that make up a box plot (Minimum, Q1, Median, Q3, Maximum)
1
S.ID.1
S.ID.2
S.ID.3
2
S.ID.1
S.ID.2
S.ID.3
3
S.ID.1
S.ID.2
S.ID.3
3
S.ID.1
S.ID.2
S.ID.3
4
S.ID.1
S.ID.2
S.ID.3
3
S.ID.1
S.ID.2
S.ID.3
3
S.ID.1
S.ID.2
S.ID.3
4
S.ID.2
S.ID.3

Enter all answers rounded to the nearest thousandth, hundredth or tenth of a foot.

A science class did an experiment testing how high they could launch 7 homemade rockets. The height in feet that each rocket reached is shown in the following data set.

Old Data {60, 68, 74, 74, 83, 85, 93}

Another group launched their rocket the 2nd day and it reached a height of 75 feet. The following data shows the 8 heights including this additional launch.

New Data {60, 68, 74, 74, 75, 83, 85, 93}

Use this to make compare the means, medians, standard deviations and find the quartiles of the new data.

2
Asemmisa {{asɛmmisaAhyɛnsode}}
9.

The MEDIAN of the New Data is

1.5
1.5
1.5
S.ID.1
S.ID.2
S.ID.3

Enter all answers rounded to the nearest thousandth, hundredth or tenth of a foot.

A science class did an experiment testing how high they could launch 7 homemade rockets. The height in feet that each rocket reached is shown in the following data set.

{60, 68, 74, 74, 83, 85, 93}

Use the data to calculate the mean, median and range.

Then, construct a box and whiskers plot of the data.

Asemmisa {{asɛmmisaAhyɛnsode}}
1.

What is the SUM of all the heights of the rockets?

Asemmisa {{asɛmmisaAhyɛnsode}}
2.

What is the MEAN of the heights of the rockets?

Asemmisa {{asɛmmisaAhyɛnsode}}
3.

What is the MEDIAN of the heights of the rockets?

Asemmisa {{asɛmmisaAhyɛnsode}}
4.

What is the RANGE of the heights of the rockets?

Asemmisa {{asɛmmisaAhyɛnsode}}
5.

The value of the 1st quartile is feet.

Asemmisa {{asɛmmisaAhyɛnsode}}
6.

What is the INTERQUARTILE RANGE (IQR) of heights of the rockets?

Asemmisa {{asɛmmisaAhyɛnsode}}
7.

Which box and whiskers plot accurately displays the data?

Asemmisa {{asɛmmisaAhyɛnsode}}
8.

How high would a rocket need to travel on the 8th launch to raise the mean to 80 feet?

Asemmisa {{asɛmmisaAhyɛnsode}}
10.

The MEAN of the New Data is the STANDARD DEVIATION of the Old Data.

Asemmisa {{asɛmmisaAhyɛnsode}}
12.

The value of the 1st quartile of the new data is feet.

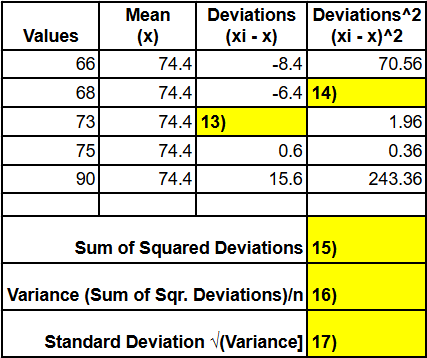
The class averages on the 1st 5 Geometry tests are shown below.

{66,68,73,75,90}

Use the table below to calculate the standard deviation of ALL class averages. A paper copy of the table below will be provided to you. Please record your answers on it and turn it in.

Asemmisa {{asɛmmisaAhyɛnsode}}
13.

What is the missing deviation?

Answer without rounding.

Asemmisa {{asɛmmisaAhyɛnsode}}
14.

What is the missing squared deviation?

Answer without rounding.

Asemmisa {{asɛmmisaAhyɛnsode}}
15.

What is the sum of the squared deviations?

Answer without rounding.

Asemmisa {{asɛmmisaAhyɛnsode}}
16.

What is the population variance?

Answer without rounding.

Asemmisa {{asɛmmisaAhyɛnsode}}
17.

What is the population's standard deviation?

Round to the nearest tenth.

Asemmisa {{asɛmmisaAhyɛnsode}}
18.

66 is more than 1 standard deviation from the mean.

Asemmisa {{asɛmmisaAhyɛnsode}}
19.

90 is more than 1 standard deviation from the mean.

Asemmisa {{asɛmmisaAhyɛnsode}}
21.

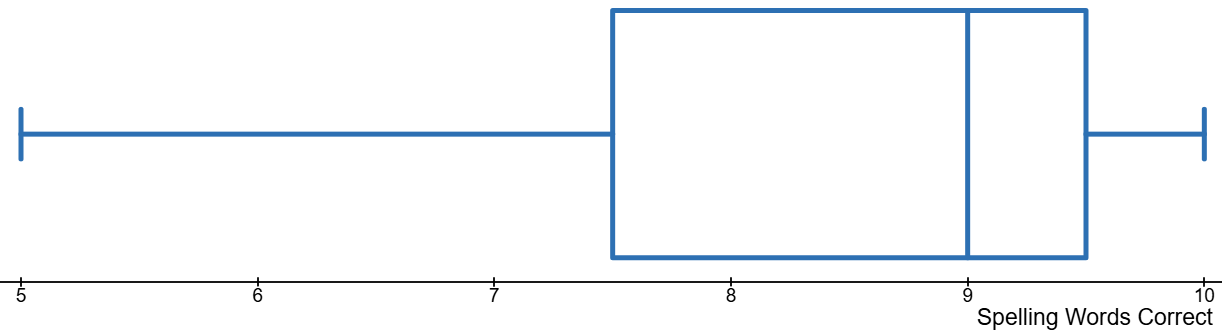
50% of the class spelled between 7.5 words and 9.5 words correctly.

Asemmisa {{asɛmmisaAhyɛnsode}}
22.

50% of the class spelled between 9 words and 10 words correctly.

Asemmisa {{asɛmmisaAhyɛnsode}}
23.

25% of the class spelled 7.5 or more words correctly.