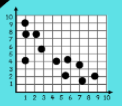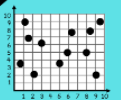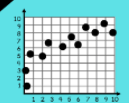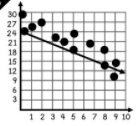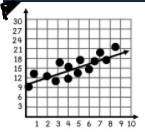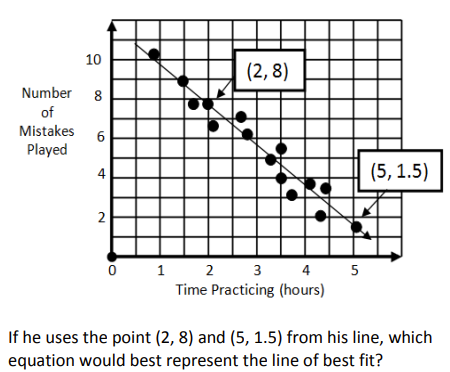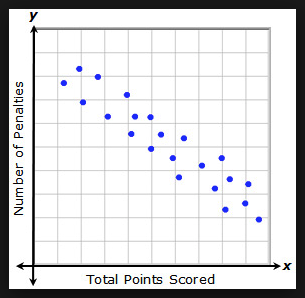
Select all that apply to describe the association of this scatterplot. Choose two options
Select all that apply to describe the association of this scatterplot. Choose two options
Answer all the questions you are able to. Do the questions you know how to do first and then go back to the ones that were difficult. Each question is worth a different value.
Select all that apply to describe the association of this scatterplot. Choose two options
Drag each item to the correct description of the relationship.
Positive
Negative
None
Move the graphs to their appropriate description.
Item 1
Too High
Too Low
Just Right
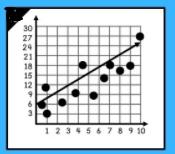
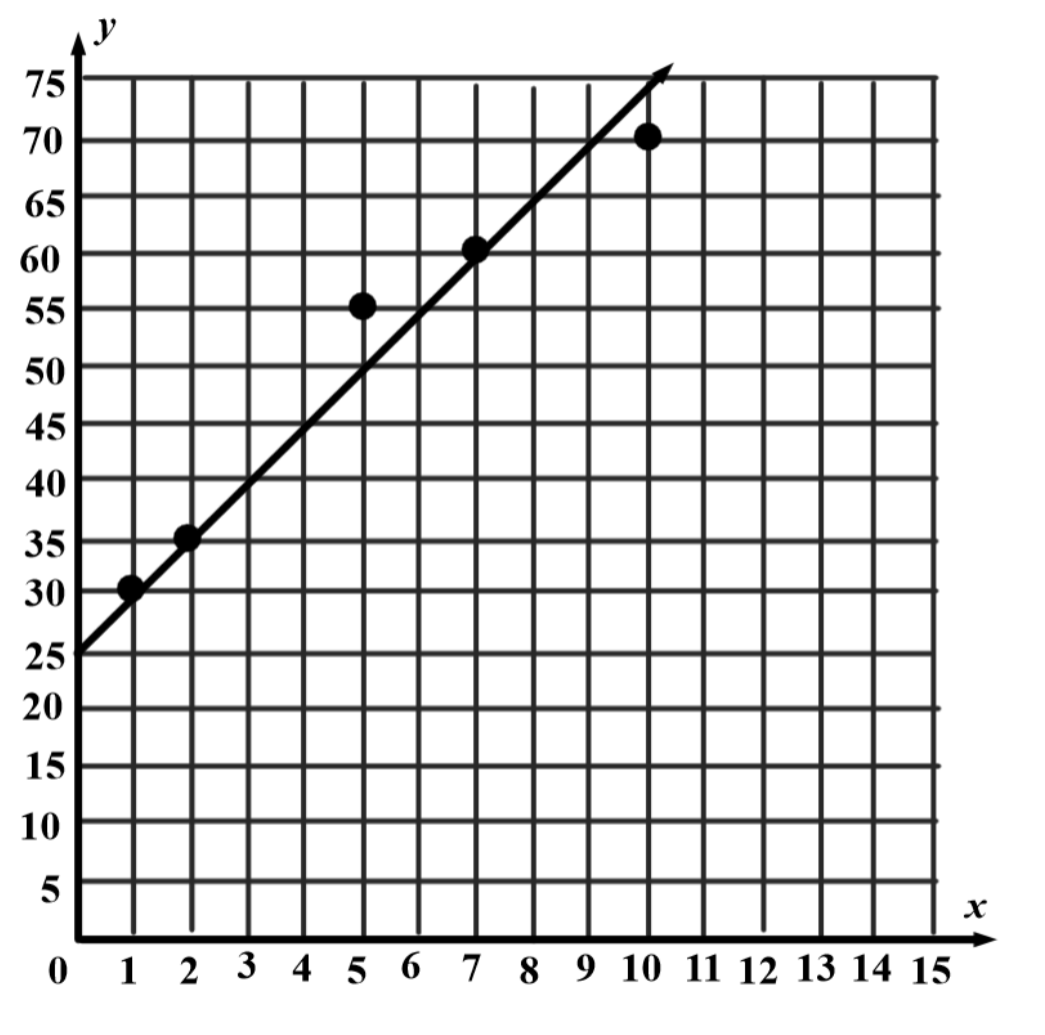
A scatter plot was constructed on the graph below, and a line of best fit was drawn. What is the equation of this line of best fit? Find the slope and then find the y-intercept. y=mx+b
Select the correlation values that show a weak condition:
Hint: there are 3
Select the correlation values that show a strong correlation:
Hint: there are 3
The correlation coefficient, r, is given for several different linear models for a data set. Sort the r values from best fit (top) to worst fit (bottom).
-0.34
-0.82
0.01
-0.95
Determine if the situation is causation or correlation.
The amount of shoes bought and the amount of starbucks bought.
the amount one sweats and the temperature outside
the speed you drive and the amount of rain there is
Causation
Correlation
Domestic travel during summer vacation can get
pricey. The average cost per person for food, lodging, and airfare averages $790 per person with a standard deviation of $120.
Determine the z score value of someone who spent $780 per person for their vacation?
What percentage is represented by the family that spent $780 per person? Round to the nearest tenth.
Given that the variance of $7,504, what is the standard deviation?
On average the weather in El Centro, California averages 107 degrees Fahrenheit during the month of July. The standard deviation is 3.4 degrees.
What percentage of days were 105 degrees or less? Use the z-score table.
What percentage of days were 111 degrees or more? Use z score table
What percent of days was the weather between 105 and 111 degrees in July?
A scatter plot was constructed on the graph below and a line of best fit was drawn. What is the equation of this line of best fit?
Below are the prices of the shoes Vanessa's mom found online. Determine the table value, the range, the variance, and the standard deviation.
Determine the mean price of shoes. Don't forget your dollar sign and 2 decimal places!
Determine the range of the prices. Dollar sign!!
Determine the variance.
Determine the standard deviation.
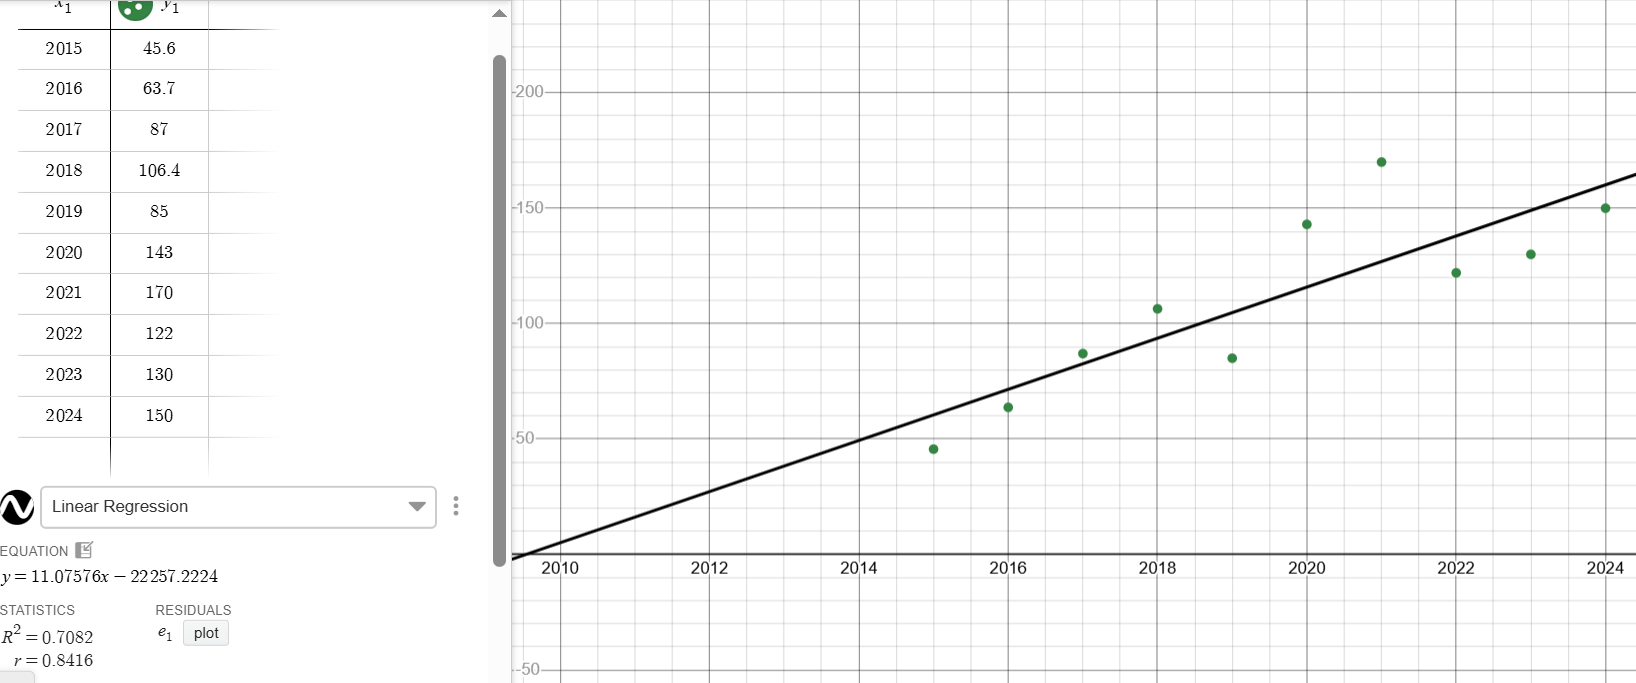
The graph to the left shows the amount of money spent on Apps in billions. What is the line of best fit?
What is the regression value?
The graph to the left shows the amount of money spent on Apps in billions. Using extrapolation(algebra), determine how much money would be spent in 2030? Round to the nearest tenth in BILLIONS!!! LABEL!!!
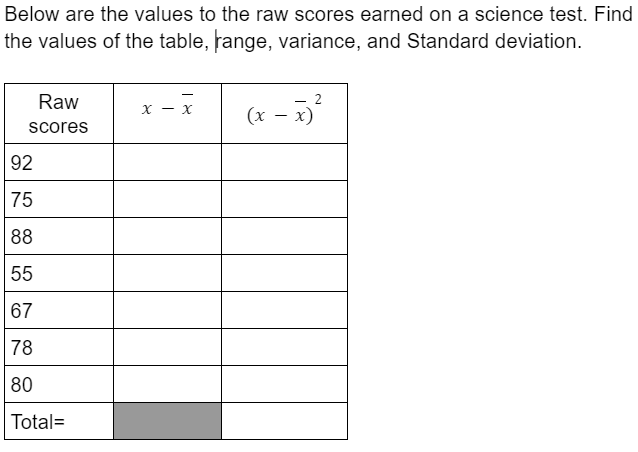
What is the mean? Round to the nearest tenth. (One decimal place!)
Type answer to deviation of 92. Round to the nearest tenth. (One decimal place!)
Type answer to the deviation of 55. Round to the nearest tenth. (One decimal place!)
Type answer to the deviation of 67. Round to the nearest tenth. (One decimal place!)
Type answer to the squared deviation of 88. Round to the nearest tenth! (one decimal place)
Type answer to the squared deviation of 78 here. Round to the nearest tenth! (one decimal place)
What is the range of the science test?
What is the variance of the table? Round to the nearest tenth! (one decimal place)
What is the standard deviation? Round to the nearest tenth! (one decimal place)