Twa kɔ nsɛm atitiriw so
Log in
Sign up for FREE
arrow_back
Laabri

2026 (Aug.): NY Regents - Earth and Space Science

star
star
star
star
star
Last updated 5 days ago
50 Nsɛmmisa
Hyɛ no nsow a efi ɔkyerɛwfo no hɔ:

A four-function or scientific calculator and a copy of the 2024 Edition Reference Tables for Earth and Space Sciences must be available for you to use while taking this examination. Note that diagrams are not drawn to scale unless otherwise noted.

A four-function or scientific calculator and a copy of the 2024 Edition Reference Tables for Earth and Space Sciences must be available for you to use while taking this examination. Note that diagrams are not drawn to scale unless otherwise noted.

Base your answers to questions 1 through 4 on the information below and on your knowledge of Earth and Space Sciences. Some questions may require the use of the 2024 Edition Reference Tables for Earth and Space Sciences. Be sure to record your answers for multiple-choice questions on the separate answer sheet provided. Record your answers for constructed-response questions in your test booklet.

Cyclic Patterns

Knowing how much tides will rise and fall each day is important to mariners, fishermen, and people who operate seaside industrial and commercial facilities. Predicting the tides is actually very complicated because many factors influence tides, such as the shape of the coastline, the flow of currents, and even the weather.

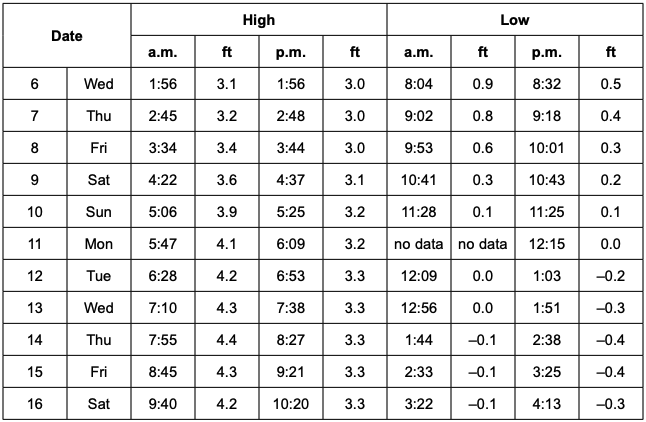
The table below shows the times and water levels for tides at a location in New York State. Water levels are relative to local standard elevations (average sea level).

Jones Inlet, NY, Tide Data December 6 - 16, 2023
The combined gravitational forces that the Moon and the Sun exert on Earth result in the strength of tides. Spring tides and neap tides occur cyclically. The model below represents one possible set of positions of the Sun, Earth, and the Moon during a spring tide and a neap tide.

Sun-Earth-Moon System Model
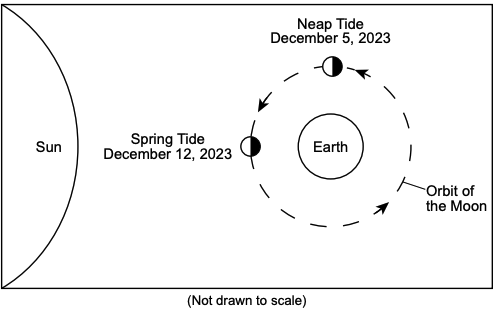
Perigean spring tides are the strongest spring tides and apogean spring tides are the weakest spring tides. The table below shows some information about the Moon’s position in its orbit around Earth.

Approximate Earth-Moon Distance

Moon's Distance from Earth (km)

Date

369,818

November 21, 2023

404,346

December 4, 2023

367,899

December 16, 2023

404,910

January 1, 2024

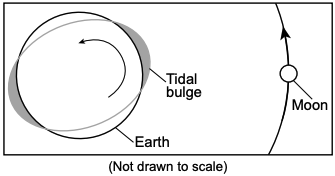
The rate of Earth’s rotation is affected by lunar tidal friction. The gravitational force of the Moon causes a tidal bulge in the solid Earth and its oceans, as shown in the model below. The arrow on Earth indicates direction of rotation.

Simplified Model of Earth’s Tidal Bulge (not drawn to scale)
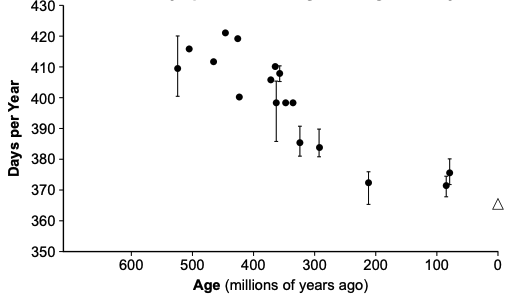
Evidence of the change in the rate of Earth’s rotation has been found by studying ancient ocean organisms. These organisms developed growth lines on a daily basis. The number of days per year has been determined by counting these growth lines, as shown in the graph below. The $\triangle$ represents the number of days per year determined by the growth lines of modern-day ocean organisms.

Earth Days per Year Through Geologic History
1
HS.ESS1.7
1
HS.ESS1.7
1
Asemmisa {{asɛmmisaAhyɛnsode}}
3.

Of the two options below, indicate the date on which the orbital speed of the Moon around Earth was greater. Then, justify your response using your knowledge of Kepler’s Laws.

Orbital speed on December 16, 2023

or

Orbital speed on January 1, 2024
HS.ESS1.4
1
HS.ESS1.4

Base your answers to questions 5 through 9 on the information below and on your knowledge of Earth and Space Sciences. Some questions may require the use of the 2024 Edition Reference Tables for Earth and Space Sciences.

Chesapeake Bay Impact Event

Scientists have determined that an asteroid or meteorite between three to five kilometers in diameter hit the continental shelf of North America. This area is located near the present-day Chesapeake Bay. The impact occurred about 35 million years ago, when sea level was much higher.

A drill core sample was taken near the impact crater (Langley drill core). Scientists used a radioactive dating method on several zircon crystals found in the sample to determine the age of impact. These crystals formed when the existing rock material was subjected to the intense heat and pressure of the impact. This altered the structure of the rock. This Earth material was blasted away from the crater, forming ejecta material.

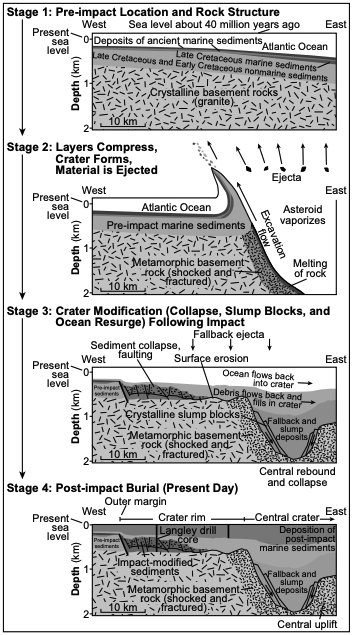
The models below show some information about the sequence of events and geologic changes that occurred to the continental shelf as a result of this impact event (Stage 2).

Progression of Chesapeake Bay Impact Event

1
HS.ESS1.6
1
Asemmisa {{asɛmmisaAhyɛnsode}}
6.

Based on the rock samples that have been found around the impact site, identify the parent isotope that could have been used to determine the age of the impact crater found in the Chesapeake Bay. Explain why that radioactive isotope can be used to date the zircons found in the sample.

Parent radioactive isotope:

Explanation:

HS.ESS1.6
1
HS.ESS2.1
1
HS.ESS1.6
1
HS.ESS2.3

Base your answers to questions 10 through 14 on the information below and on your knowledge of Earth and Space Sciences. Some questions may require the use of the 2024 Edition Reference Tables for Earth and Space Sciences.

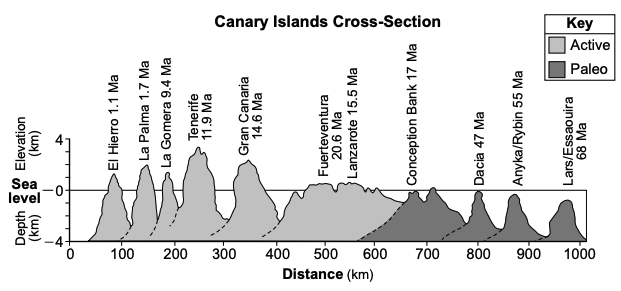
Canary Islands Hotspot

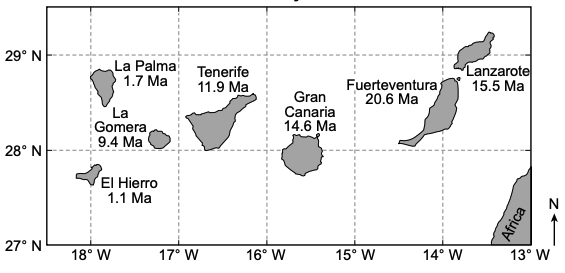
The Canary Islands are a series of islands and seamounts located near the west coast of Africa. These islands formed over a hotspot. The map below shows some information about the Canary Islands. Approximate island ages are shown in millions of years (Ma).

The Canary Islands

The cross-section below shows some information about the Canary Islands region. A distance of 0 km represents the relative start of the island chain.

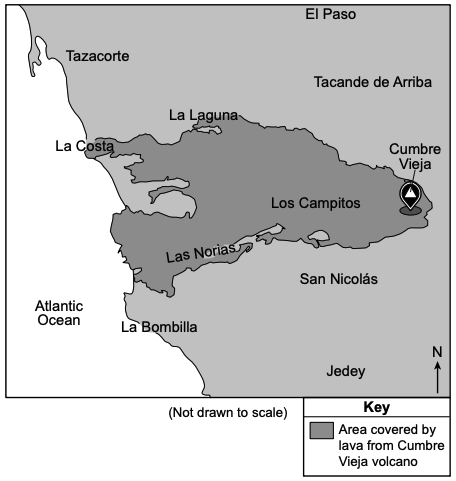
In September through December of 2021, thousands of earthquakes, known as an earthquake swarm, were detected beneath the Cumbre Vieja volcano on the island of La Palma. Eruptions released volcanic ash and lava fl ows. The map below shows some information about the island of La Palma.

Portion of La Palma Showing Cumbre Vieja Volcano

1
HS.ESS2.1
1
Asemmisa {{asɛmmisaAhyɛnsode}}
11.
HS.ESS2.1
1
Asemmisa {{asɛmmisaAhyɛnsode}}
12.

HS.ESS2.3
1
HS.ESS2.8
1
HS.ESS3.1

Base your answers to questions 15 through 18 on the information below and on your knowledge of Earth and Space Sciences. Some questions may require the use of the 2024 Edition Reference Tables for Earth and Space Sciences.

Earth’s Oceans–A Climate Change Indicator

Earth’s ocean temperatures influence sea level change and climate. Oceans have the ability to absorb large amounts of heat energy with only a slight increase in temperature because of water’s unique properties.

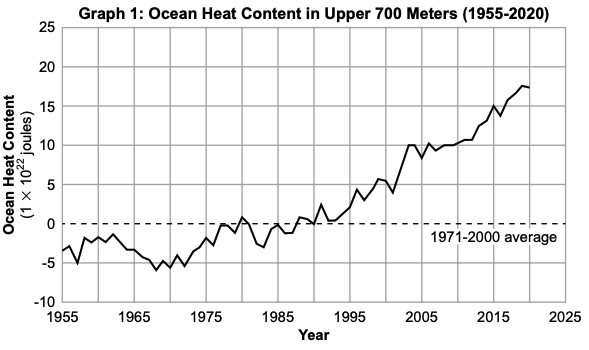
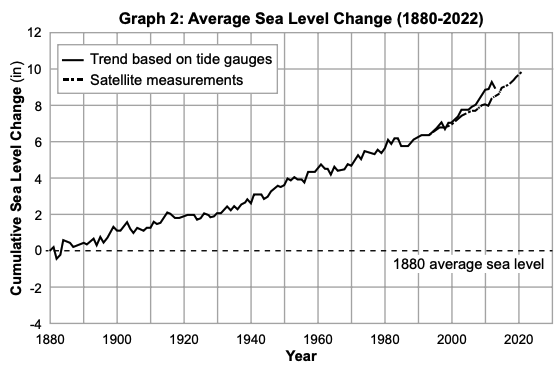
The graphs show some information about ocean heat content and sea level change. Joules are a unit of energy. One unit of ocean heat content is equal to $1 \times 10^{22}$ joules. This amount of energy is equal to approximately 17 times the amount of energy used by all humans on Earth in one year.

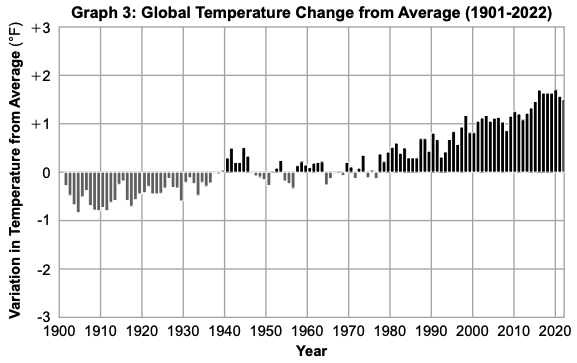
The graph below shows Earth’s combined global land and ocean surface temperature variations from average. The 0 value is based on temperature data collected between 1901 and 2000 and represents the average atmospheric temperature.

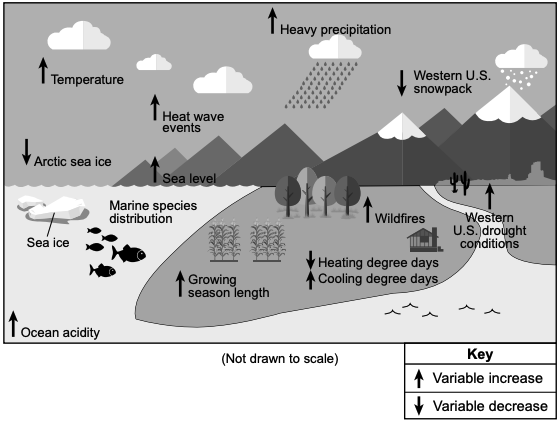
The infographic below shows some information about changes in natural processes and human activities. Heating and cooling degree days are the amount of days needed to either heat or cool a home.

Trends in Processes and Activities Related to Current Climate Change

1
HS.ESS2.5
1
Asemmisa {{asɛmmisaAhyɛnsode}}
16.

Using data shown in Graphs 1, 2, and 3, describe how ocean heat content, average sea level, and global average temperature have changed from the average values since 1980 due to human activities.

HS.ESS3.6
1
HS.ESS3.1
1
HS.ESS2.4
1
HS.ESS2.5
1
Asemmisa {{asɛmmisaAhyɛnsode}}
20.

Using your knowledge of seasonal water cycle processes, explain why the salinity of the body of water at Iceberg Canyon is different in autumn than in spring.

HS.ESS2.5
1
HS.ESS3.1
1
HS.ESS3.4
1
HS.ESS2.4
1
HS.ESS2.6
1
HS.ESS3.6
1
Asemmisa {{asɛmmisaAhyɛnsode}}
26.

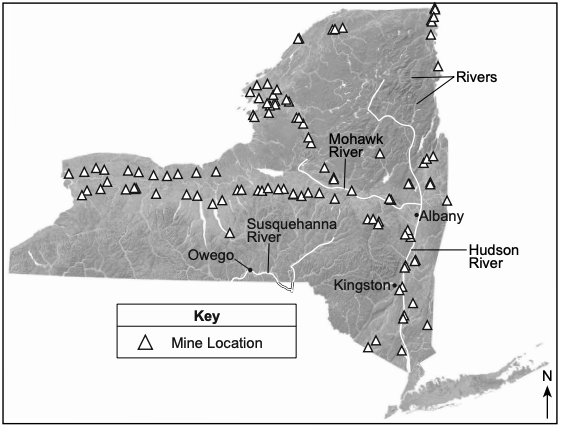
Identify one natural or mineral resource that supports the claim that Albany and Kingston were considered to be better locations for a capital city than Owego. Explain how this natural or mineral resource most likely influenced the decision about where to construct the capital.

Natural resource:

Explanation:

HS.ESS3.1
1
HS.ESS3.2
1
Asemmisa {{asɛmmisaAhyɛnsode}}
28.

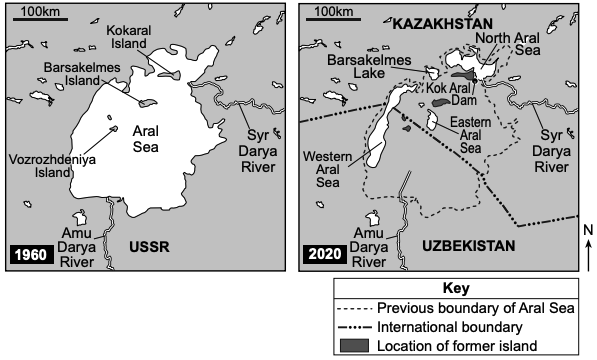
Construct an argument about how diverting the Amu Darya and Syr Darya rivers from 1960 to 1990 impacted both the Aral Sea and its biodiversity. Include numerical evidence for both the Aral Sea and its biodiversity in your argument.

HS.ESS2.7
1
HS.ESS2.2
1
Asemmisa {{asɛmmisaAhyɛnsode}}
30.

Use the data tables and maps to describe how the management of fresh water in the Aral Sea region most likely negatively impacted the stability of the human population after 1990.

HS.ESS3.3
1
HS.ESS2.2
1
HS.ETS1.3
1
Asemmisa {{asɛmmisaAhyɛnsode}}
33.

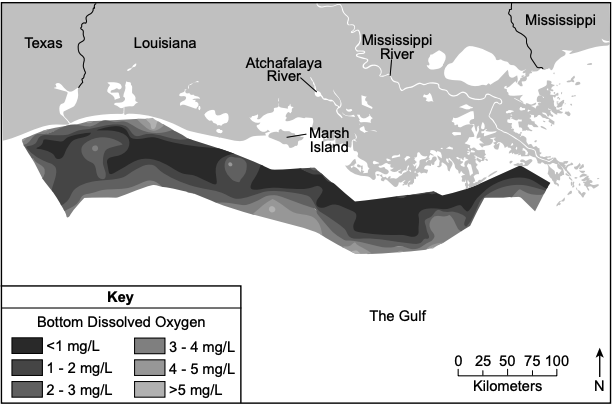
Use numerical data to describe how both the ocean and aquatic life are affected 30 km south of Marsh Island’s southernmost coast as a result of agricultural runoff.

Ocean:

Aquatic life:

HS.ESS3.6
1
HS.ESS2.2
1
Asemmisa {{asɛmmisaAhyɛnsode}}
35.

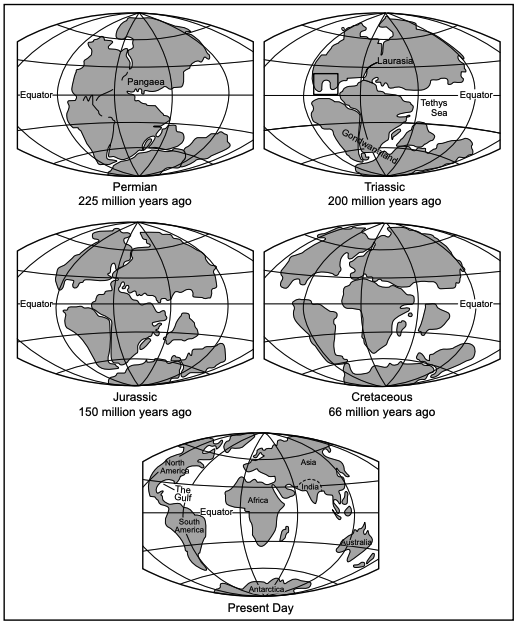
The models below show some information about the formation of the presentday Gulf. The box in the Triassic model indicates the position of the early Gulf basin after the breakup of Pangaea.

How the Gulf Formed

Use the models to explain how Earth’s internal tectonic processes were responsible for the formation of the Gulf over a 200-million-year time span.

HS.ESS2.1
1
HS.ESS3.3
1
HS.ESS2.8

Base your answers to questions 38 through 41 on the information below and on your knowledge of Earth and Space Sciences. Some questions may require the use of the 2024 Edition Reference Tables for Earth and Space Sciences.

Full Supermoon Events in 2024

A full “supermoon” occurs when the Moon is at or very close to perigee in its orbit of Earth during full Moon phase. Perigee is when the Moon is closest to Earth. The apparent size of the Moon is measured from Earth as an angular diameter. Angular diameter measures the size of a circular disk in arc minutes.

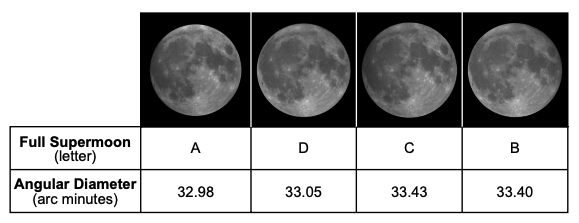
The data tables and photographs below contain information about four full supermoons in 2024. The four Moon photographs are shown to scale relative to each other.

Date

Moon Distance from Earth (km)

August 19

361,969

September 18

357,485

October 17

357,363

November 15

361,866

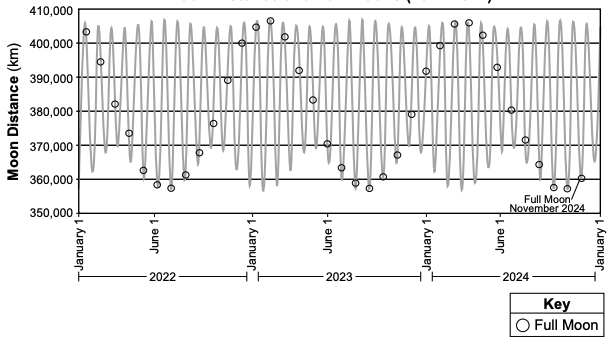
The graph below shows information about the cyclic changes that occurred in the Moon’s distance from Earth. The full Moon for December 2024 has been intentionally omitted.

Moon Distance and Full Moons (2022-2024)

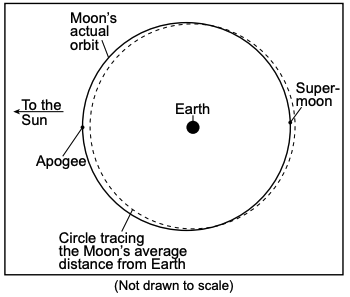
The model below shows some information about the Moon’s orbit around Earth.

Supermoon and Apogee Positions in Moon's Orbit

The Saros series is used to predict the occurrence of eclipses when the Sun, Earth, and Moon are aligned in the same geometry to produce identical eclipse conditions. The period of time between these eclipses is 18 years, 11 days, and 8 hours. A total solar eclipse was observed in Plattsburgh, New York, on April 8, 2024 at 3:25 p.m. This total solar eclipse occurred when the new Moon was near perigee.
1
Asemmisa {{asɛmmisaAhyɛnsode}}
38.

Write the letter for each full supermoon from the data table in the space provided next to the month each supermoon occurred. Then, explain how the relationship between the Moon’s distance from Earth and the Moon’s angular diameter provided evidence to support your identifications.

August:
September:
October:
November:

Explanation:

HS.ESS1.7
1
HS.ESS1.7
1
HS.ESS1.4
1
HS.ESS1.4
1
HS.ESS2.2
1
HS.ESS2.4
1
HS.ESS2.8
1
Asemmisa {{asɛmmisaAhyɛnsode}}
45.

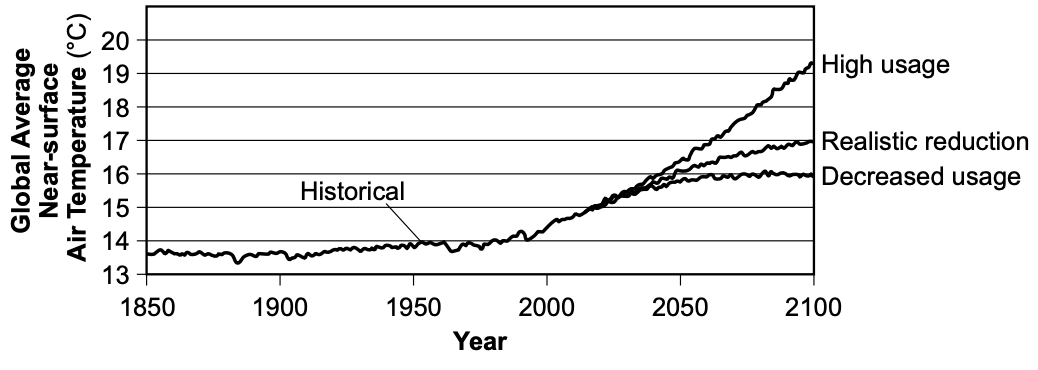
Determine the forecasted change in global average temperature in $\degree$ C according to the realistic reduction scenario of fossil fuel usage from 2020 to 2100.

HS.ESS3.5
1
Asemmisa {{asɛmmisaAhyɛnsode}}
46.

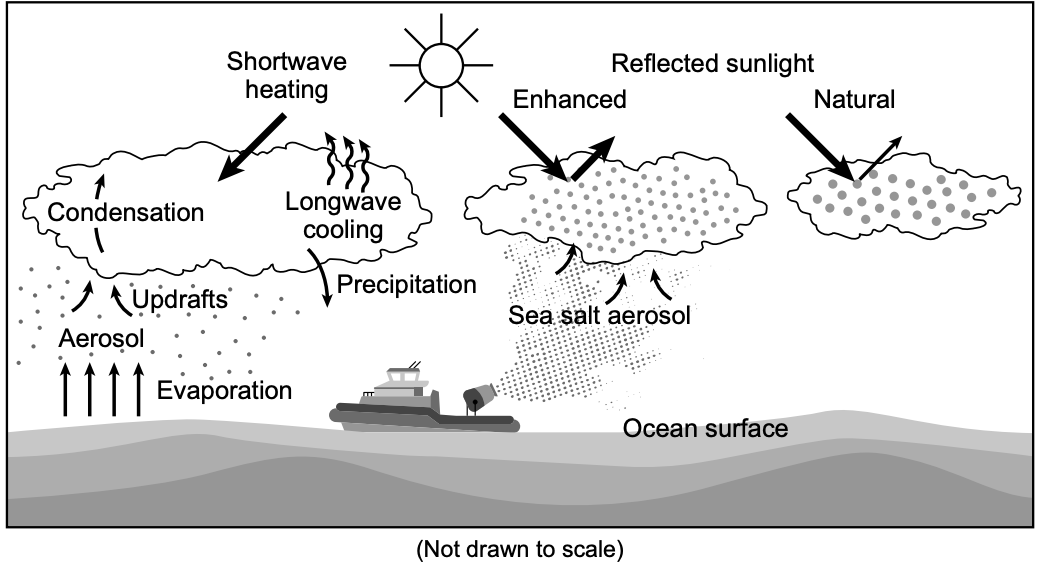
The MCB solution to climate change involves many trade-offs. Select one positive and one negative trade-off and explain how each selection is positive or negative.

Positive Trade-offs:
-Ships can travel over large areas of the ocean
-Introducing seawater into atmosphere
-Altering weather patterns

Positive Trade-off selected:
Explanation:

Negative Trade-offs:
-Ships can travel over large areas of the ocean
-Introducing seawater into atmosphere
-Altering weather patterns

Negative Trade-off selected:

Explanation:

HS.ETS1.3

Base your answers to questions 47 through 50 on the information below and on your knowledge of Earth and Space Sciences. Some questions may require the use of the 2024 Edition Reference Tables for Earth and Space Sciences.
Stars and Elements in the Universe

The table below describes the elements that form throughout a star’s lifetime. A solar mass of one is equivalent to the mass of our Sun.

Main sequence

Red giant

Supergiant

Supernova

Star stages/Events

Stars in the early/middle of their life cycles

(0.3-8 solar masses) when the hydrogen is depleted and the star begins to change

(8 to 100 solar masses) when the helium is depleted at the end of its lifetime

When a massive star explodes

Core Elements Formed

Fusion of hydrogen into helium

Helium primarily fuses into carbon, then oxygen

Fusion of heavier elements but not heavier than iron

Elements heavier than iron

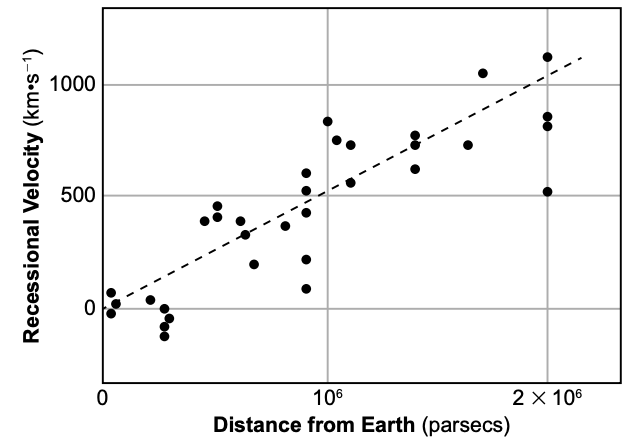
In the early 1900s, scientists believed the size of the universe was unchanging. In 1912, astronomer Henrietta Leavitt established the relationship between a star’s distance and its apparent brightness. In 1924, Edwin Hubble used Leavitt’s Law to measure distances to remote objects by looking at the speed these celestial objects (galaxies) were traveling. They were then graphed against the distance from Earth in parsecs, which is the distance light travels in 3.26 years (19 trillion miles). A simplified graph of Hubble’s data shows the speed that galaxies are moving away from Earth (recessional velocity) and the galaxy’s distance from Earth.

Plot if Galaxy Velocity and Distance

1
HS.ESS1.3
1
HS.ESS1.1
1
HS.ESS1.2
1
HS.ESS1.2
Asemmisa {{asɛmmisaAhyɛnsode}}
1.

Which evidence-based explanation supports the claim that ocean tides at Jones Inlet, New York, change cyclically?

Asemmisa {{asɛmmisaAhyɛnsode}}
2.

Which evidence-based statement supports the claim that the occurrence of a specific Moon phase is associated with an Earth tide?

Asemmisa {{asɛmmisaAhyɛnsode}}
4.

Based on the information in the Simplified Model of Earth’s Tidal Bulge model and the Earth Days per Year Through Geologic History graph, which row in the table correctly predicts the length of an Earth day 500 million years ago and explains why this length is different today?

Row

Length of Earth Day

Explanation

1

Approximately 21.5 hours

Earth’s rate of rotation was faster 500 million years ago.

2

Approximately 26.5 hours

Earth’s rate of rotation was faster 500 million years ago.

3

Approximately 21.5 hours

Earth’s rate of rotation was slower 500 million years ago.

4

Approximately 26.5 hours

Earth’s rate of rotation was slower 500 million years ago.

Asemmisa {{asɛmmisaAhyɛnsode}}
5.

The piece of evidence that directly supports the claim that an impact event occurred about 35 million years ago in the Chesapeake Bay Region is

Asemmisa {{asɛmmisaAhyɛnsode}}
7.

Which two stages in the models are evidence of constructive processes associated with the formation of the present-day Chesapeake Bay crater?

Asemmisa {{asɛmmisaAhyɛnsode}}
8.

Describe one piece of evidence that could be used to prove that the ancient marine sediments in Stage 1 were deposited after the late Cretaceous marine sediments.

Asemmisa {{asɛmmisaAhyɛnsode}}
9.

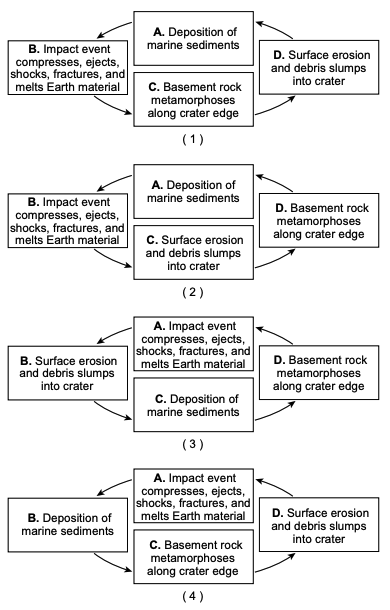
Which sequence (A–D) correctly identifies the stages of recycling of Earth materials that occurred in the Chesapeake Bay?

Asemmisa {{asɛmmisaAhyɛnsode}}
10.

Which statement describes the approximate spatial and temporal scales associated with the movement of the African Plate as it travels over the Canary Islands Hotspot?

For each of the three locations, select the correct surface feature and the correct geologic epoch from the dropdown menus.

Location

Surface Feature

Geologic Epoch

La Palma

Tenerife

Dacia

A student studying the mineral composition of a basalt sample from Gran Canaria made the following claim:

“The Gran Canaria basalt sample has a felsic composition and contains sodium-rich minerals.”

Cite evidence about the composition of basalt to refute the student’s claim. Justify your response by including at least two minerals as evidence.

Asemmisa {{asɛmmisaAhyɛnsode}}
13.

The Canary Islands region experiences relatively low average annual rainfall when compared to other tropical locations.

Which statement explains why the Canary Islands region experiences low average annual rainfall?

Asemmisa {{asɛmmisaAhyɛnsode}}
14.

Which statement best describes how the earthquake swarm most likely helped predict another natural hazard and allowed communities to prepare for a larger natural disaster?

Asemmisa {{asɛmmisaAhyɛnsode}}
15.

Which table correctly matches the ocean trends that are most directly affected by the properties of water shown in the graphs?

Asemmisa {{asɛmmisaAhyɛnsode}}
17.

Which set of explanations correctly describe how human activities will most likely be influenced by current changes in climate?

A. People will need to cool their homes for more days per year.

B. There will be less food production due to a change in growing season length.

C. Farmers may need to decrease the amount of time used to successfully grow crops in the western U.S.

D. Coastal communities will have to plan for an increase in coastal flooding due to a decrease in Arctic Sea ice.

Asemmisa {{asɛmmisaAhyɛnsode}}
18.

Based on the information provided, which statement correctly explains how changes in energy flow due to human activities result in a change to a climate factor?

Base your answers to questions 19 through 22 on the information below and on your knowledge of Earth and Space Sciences. Some questions may require the use of the 2024 Edition Reference Tables for Earth and Space Sciences.
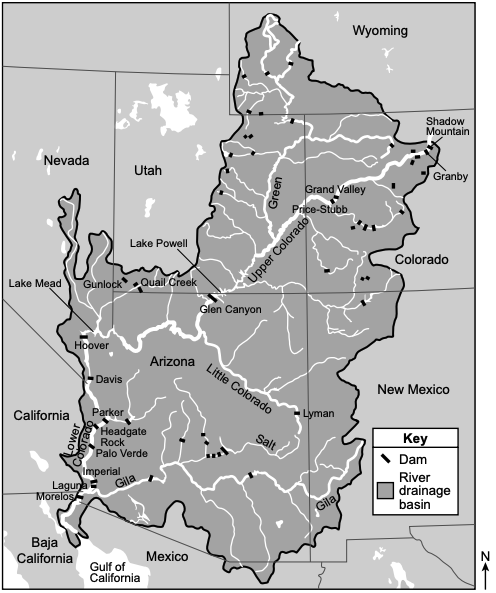
Dams on the Colorado River

There are over 14 major dams located along the 1450-mile-long Colorado River. The dams were built to ensure equitable distribution of water along the entire length of the Colorado River. Two of the largest dams found along the Colorado River are the Hoover and Glen Canyon. The reservoirs (Lake Mead and Lake Powell) that were created upstream of the dams are two of the largest in the United States. During years of drought, these dams guarantee water to the Lower Colorado River states (Lower Basin). In years with excess precipitation, the dams store runoff for future use. Both dams are also a major source of hydroelectricity. The dams control seasonal flooding along the Colorado River and provide irrigation for farming.

The map below shows some information about the Colorado River. The Colorado River is the boundary between California, Nevada, and Arizona.

The Colorado River: Its Tributaries and Dams

The construction of the Hoover Dam in 1935 created Lake Mead, which extends 110 miles upstream. Sedimentation in Lake Mead is generally distributed along the bottom of the deepest parts of the lake.

The data table below shows some information about sedimentation in Lake Mead. An acre-foot is equal to the volume of material that covers one acre of land to a depth of one foot.

Lake Mead Sedimentation From 1935-2001

Year

Reservoir Capacity

(acre-feet at 1220 feet elevation)

Rate of Sedimentation

(acre-feet/year)

Sediment Volume

(acre-feet)

1935

30,944,400

137,000

0

1948

29,878,000

97,429

1,066,400

1963

28,321,300

88,200

2,623,100

2001

28,543,420

< 10,000

2,400,980*

* due to significant compaction of sediments in some parts of the lake

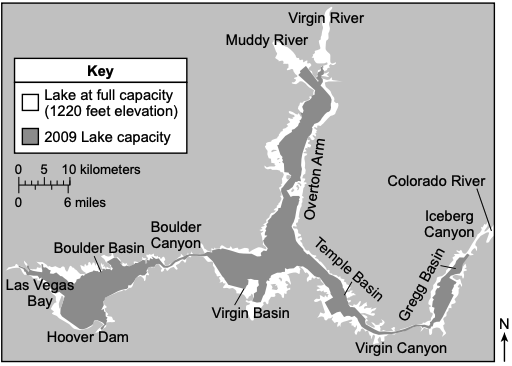
A 14-year investigation of seasonal salinity levels was conducted in Lake Mead. The map below shows some of the locations where salinity was measured.

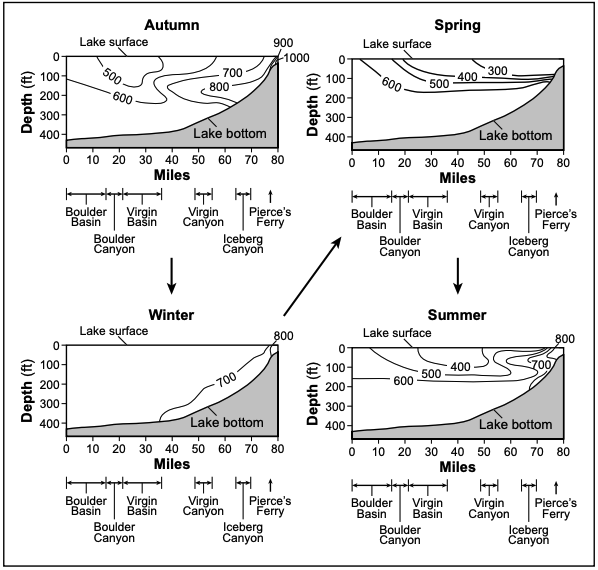
The salinity cross-sections contain isolines that indicate salinity levels in parts per million (ppm).

Named Locations Along Lake Mead

The salinity cross-sections contain isolines that indicate salinity levels in parts per million (ppm).

Salinity Cross-Sections for Four Seasons

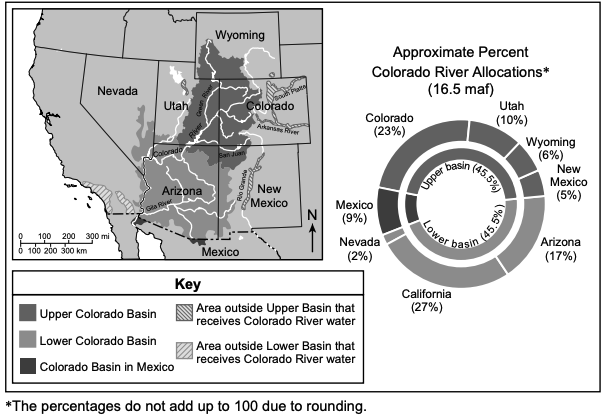
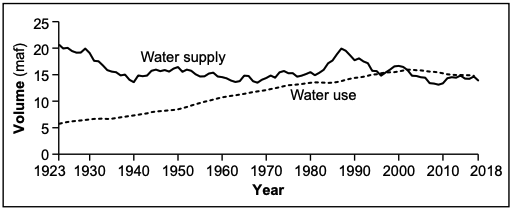
The map, model, and graph below show some information about the states that use water along the Colorado River. The unit maf represents millions of acre-feet.

Upper and Lower Basin States that Rely on the Colorado River for Water

Water Use in Lower Basin States

The Colorado River supplies water for a large farming industry in California and for many southern California cities. Due to drought conditions that have occurred in western states when supply did not meet demand, lower basin states have had to change their water usage practices. Some examples of these changes are summarized below.

  • Farmers that use irrigation in California have exchanged money for 500,000 acre-feet of water a year to southern California communities.

  • Farmers in California are investing in more efficient irrigation systems and intentionally not using large areas of land.

  • Nevada is paying residents in many communities to not plant grass and remove existing grass.

  • Arizona, Nevada, and California all agreed to reduce water usage until 2026 by at least 3 million acre-feet for each state.

  • California lined several water canals to prevent water loss along the canals.

Dams cause ecosystems to change when the normal flow of water is disrupted. The Glen Canyon Dam is downstream of Lake Powell. Drought conditions have caused the elevation of the lake to decrease and the temperature of the water to increase.

Warm water smallmouth bass now live in the lake. They pass through the dam and spawn downstream in the Colorado River. They prey on federally protected native fish species in the Grand Canyon downstream region.

Water management scientists have decided to release cold water from the lake to cool the Colorado River downstream of the dam.

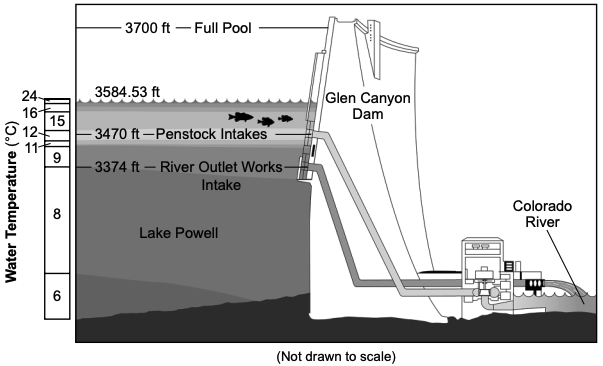
The model below shows some information about water temperatures in Lake Powell near the Glen Canyon Dam.

Lake Powell Water Temperatures (June 26, 2024)

Asemmisa {{asɛmmisaAhyɛnsode}}
19.

Which statement most accurately describes the effect of moving water on the change in sediment volume in Lake Mead during the 66-year time span shown in the table?

Asemmisa {{asɛmmisaAhyɛnsode}}
21.

Which evidence-based statement correctly describes how the availability of water in the Colorado River has influenced human activity?

Asemmisa {{asɛmmisaAhyɛnsode}}
22.

Which row shows the choice from each column that correctly completes the statement that identifies how the solution of releasing pulses of water from the dam reduces the impact of smallmouth bass on the Colorado River ecosystem?

Releasing approximately (Column 1) water below the dam will (Column 2) because it (Column 3).

Choice

Column 1

Column 2

Column 3

A

$8 \degree C$

disrupt spawning of native species

allows smallmouth bass to survive

B

$9\degree C$

increase spawning of smallmouth bass

provides warm water for spawning

C

$15\degree C$

increase spawning of native species

allows native species to eat smallmouth bass

D

$16\degree C$

disrupt spawning of smallmouth bass

makes water temperatures too cold for spawning smallmouth bass

Row

Column 1

Column 2

Column 3

1

A

C

C

2

B

D

D

3

B

A

C

4

D

A

B

Base your answers to questions 23 through 27 on the information below and on your knowledge of Earth and Space Sciences. Some questions may require the use of the 2024 Edition Reference Tables for Earth and Space Sciences.
Carbon Emissions in Industry

Concrete is the most widely used building material worldwide. It is a mixture of cement, water, sand, and gravel. Cement is the glue that holds the sand and gravel together and gives the concrete its strength.

The production of cement and the use of concrete are major contributors to carbon dioxide (CO$_2$) emissions worldwide. Cement production is the most carbon‑intensive part because it uses fossil fuels to heat a mixture of limestone (CaCO$_3$) and other ingredients to more than $2640^\circ\text{F}$ in a kiln (furnace). Making one kilogram of cement sends one kilogram of CO$_2$ into the atmosphere.

Cement and concrete materials are mined from local or regional sources. There are close to 100 quarries in New York State that mine limestone for construction materials as well as other products. A quarry is a surface mine where the soil is removed and the exposed bedrock is extracted.

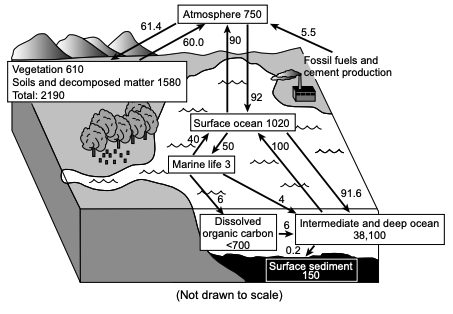
The model below represents the global exchange of carbon in different forms between Earth’s spheres. The numerical amounts in boxes represent the gigatons of carbon stored in a component of an Earth sphere. The arrows with numbers represent the amount and direction of carbon exchange between these components in gigatons per year.

Model of the Global Carbon Cycle in Gigatons of Carbon (GtC)

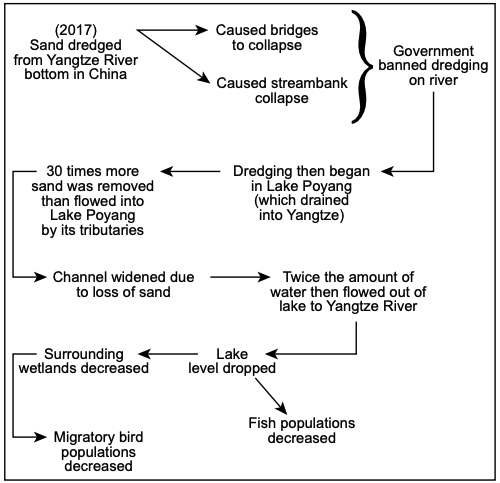
Sand mining is a necessary practice used to obtain the resources needed to make concrete. In 2017, China used 2.8 billion tons of sand in construction — enough to cover the entirety of New York State with a one-inch thick layer. Buildings, roads, and even the production of windows all require sand as a source material. The mining of sand, wherever it occurs, impacts Earth systems.

The model below shows the results of sand mining on Earth systems in China.

Model of Interacting Earth Systems Affected by Sand Mining for Concrete Production

Kingston became New York State’s first capital city in 1777, but was destroyed by the British on October 13, 1777. In the 19th century, Kingston grew in size due to its proximity to materials found in the region. Albany was later established as the permanent capital of New York State.

The map below shows some information about natural resource mines and bodies of water in New York State.

Selected Mines in New York State

Cement and concrete manufacturing uses large amounts of energy that come from burning fossil fuels. Certain steps in the manufacturing process release CO$_2$ directly into the atmosphere.

The table below lists four design solutions for cement and concrete production that have a lesser impact on Earth systems.

Design Solutions: Concrete Production

Production Step

Solution

1. Mine and grind limestone:

Grinding of limestone pieces, called “raw meal,” produces CO2 emissions.

– Use basalt instead of limestone to reduce emissions by 60 to 70%

2. Preheat raw material:

Raw material is heated to 700°C in a combustion chamber above the kiln.

– Burn oxygen-rich air instead and add equipment to capture the CO2. Burn biomass instead of fossil fuels to heat kiln. Reduces emissions by up to 60%.

3. Convert lime to clinker:

Lime is burned to 1450°C, which fuses it into nodules of cement called “clinker.” Nodules will harden with cement when reacted with water.

– Add another mineral to lower the temperature required to fuse clinker, saving energy.

4. Blend clinker with gypsum:

Clinker is mixed with gypsum in a ratio of 25 to 20

– Switch to a grinder that will save energy.

Asemmisa {{asɛmmisaAhyɛnsode}}
23.

Which row in the table below correctly completes the model to show the effect of concrete production on the amount of CO$_2$ in the atmosphere, the flow of energy within or out of Earth’s atmosphere, and the resulting change in one factor of Earth’s climate?

Row

A

B

C

1

Increases

Greater amount of energy within than energy out of

Decrease in global temperatures

2

Increases

Smaller amount of energy within than energy out of

Increase in global temperatures

3

Increases

Greater amount of energy within than energy out of

Increase in global temperatures

4

Increases

Smaller amount of energy within than energy out of

Decrease in global temperatures

Asemmisa {{asɛmmisaAhyɛnsode}}
24.

Which statement correctly describes how the cycling of carbon between two Earth spheres is represented in the model?

Asemmisa {{asɛmmisaAhyɛnsode}}
25.

Place a check mark (✓) next to the three claims that correctly describe a relationship among two Earth systems that have been modified as a result of sand mining practices in order to meet the demand for concrete production.

Asemmisa {{asɛmmisaAhyɛnsode}}
27.

Which design solution for producing cement has the best benefit to the environment?

Base your answers to questions 28 through 32 on the information below and on your knowledge of Earth and Space Sciences. Some questions may require the use of the 2024 Edition Reference Tables for Earth and Space Sciences.

The Aral Sea Region

The Aral Sea, located in arid central Asia, is fed by the Amu Darya and the Syr Darya rivers. Agricultural productivity surrounding the Aral Sea has increased since the 1950s. During the 1960s, these two rivers were diverted to support irrigation, primarily for the cotton industry. This caused the Aral Sea to shrink, reducing the amount of fish available for food. It was the fourth largest lake in the world in the 1950s. It was only the sixth largest lake in the 1990s. Today, the Aral Sea isn’t even in the top 40 largest lakes of the world.

The Kok-Aral Dam was completed in 2005 to control the water level of the shrinking Aral Sea. This dam separated the original Aral Sea into the North Aral Sea and the South Aral Sea. The Western Aral Sea is all that remains of the South Aral Sea since the construction of the dam. The dam was designed to keep water from flowing from the North Aral Sea to the South Aral Sea.

The maps below show some information about changes in the Aral Sea.

The Shrinking of the Aral Sea

The table below shows some information about the Aral Sea from 1960 to 2007.

Aral Sea Data 1960–2007

Year

Average Sea Level (m)

Annual Water Inflow ($\text{km}^3$)

Average Volume ($\text{km}^3$)

Average Salinity (%)

Number of Invertebrate and Fish Species

1960

53

56

951

10

182

1980

45

17

329

22

no data

1990

38

4

282

37

18

2007 North Aral

42

2

27

14

26

2007 South Aral

29.5

2

67.4

100

10

Aral Sea Region Changes from 1960-1990

Year

Human Population

(millions of people)

Irrigated Area

(millions of hectares)

Water Withdrawals for Irrigation in ${km}^{3}$

1960

13.8

5.0

51.5

1970

19.9

5.5

83.5

1980

26.1

5.8

110.5

1990

33.0

6.8

110.0

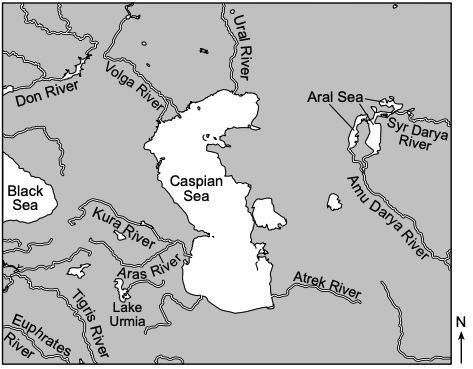
Scientists are concerned that what happened to the Aral Sea could happen to the Caspian Sea. The Volga River provides 86% of the water for the Caspian Sea. Forty dams have been constructed along the Volga River in the 20th century to provide power for the region. Construction of these dams significantly reduced the amount of water flowing through the Volga River into the Caspian Sea. This decrease in streamflow, in addition to climate change, has caused the Caspian Sea level to begin to drop.

The map below shows some information about rivers associated with the Caspian Sea and Aral Sea region.

Area Surrounding Caspian Sea and Aral Sea (2004)

Asemmisa {{asɛmmisaAhyɛnsode}}
29.

Which row in the table below contains a set of terms that correctly completes the statement below?

Construction of the Kok-Aral Dam in 2005 caused ___A___in the water level of the North Aral Sea, causing ____B___ in sediment ) ___C___ of the dam by the river.

Row

A

B

C

1

a decrease

an increase

deposition upstream

2

a decrease

a decrease

erosion downstream

3

an increase

an increase

deposition upstream

4

an increase

an increase

erosion downstream

Asemmisa {{asɛmmisaAhyɛnsode}}
31.

Which feedback pattern between Earth’s spheres supports the claim that the shrinking Aral Sea contributes to the desertification (expansion of deserts) of the region?

Asemmisa {{asɛmmisaAhyɛnsode}}
32.

Which set of criteria and constraints would be most important to consider when proposing solutions to limit the further loss of water in the Caspian Sea?

Base your answers to questions 33 through 37 on the information below and on your knowledge of Earth and Space Sciences. Some questions may require the use of the 2024 Edition Reference Tables for Earth and Space Sciences.

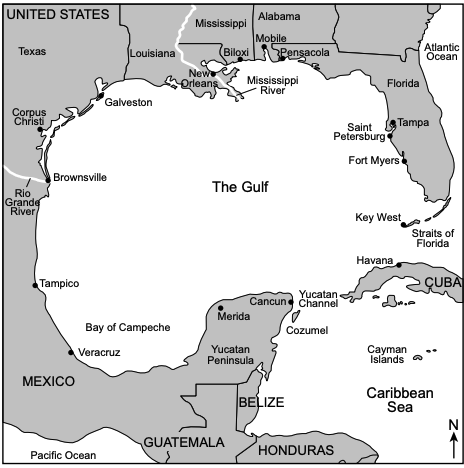
The Gulf

The Gulf of Mexico, renamed to the Gulf of America in 2025, is an oceanic basin covering approximately 1,605,794 square kilometers with coastlines in the countries of Cuba, Mexico, and the United States of America. This body of water is commonly referred to as the Gulf. Thirty-three major rivers flow into the Gulf from the United States, with the largest being the Mississippi River. Approximately 70 million people live within the Mississippi River watershed.

Map of the Gulf

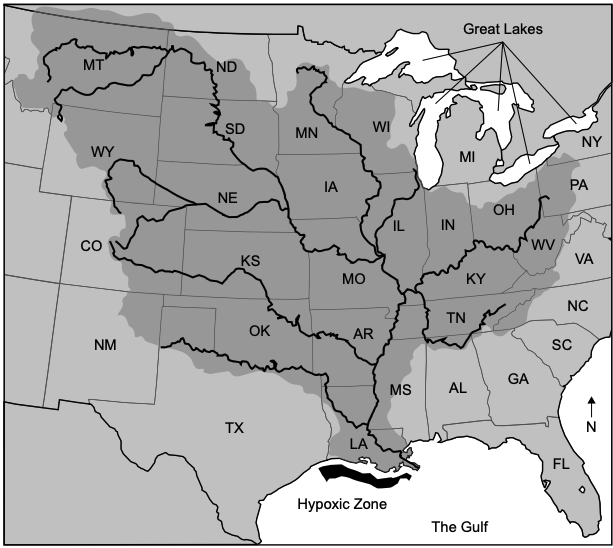
The Mississippi River watershed occupies about 3.1 million square kilometers of the United States. Most of this area is located in midwestern states. This is where agriculture plays a large economic role. Some farming practices negatively affect Earth systems.

The maps show some information about the Mississippi River watershed and a zone of hypoxia. The watershed area is shown on the map as a darker gray region. Hypoxia occurs when there is a critically low level of dissolved oxygen in the water. Dissolved oxygen levels of less than two to three mg/L can no longer support most aquatic life.

Map of Mississippi River Watershed and Hypoxic Zone

2024 Hypoxic Zone - Bottom Dissolved Oxygen

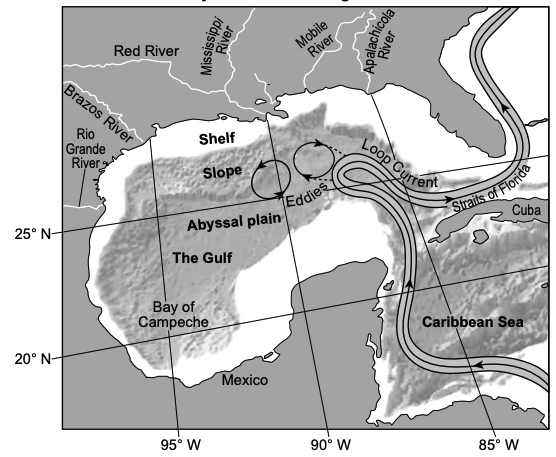
The Loop Current is the main surface ocean circulation feature in the open region of the Gulf. The eddies associated with the Loop Current change both spatially and temporally depending on the season. Climate computer models have projected that climate change will weaken the Loop Current and the eddies during this century. The map below shows some information about the Gulf region.

Topography, Surface Ocean Currents, and Major Rivers Affecting the Gulf Basin

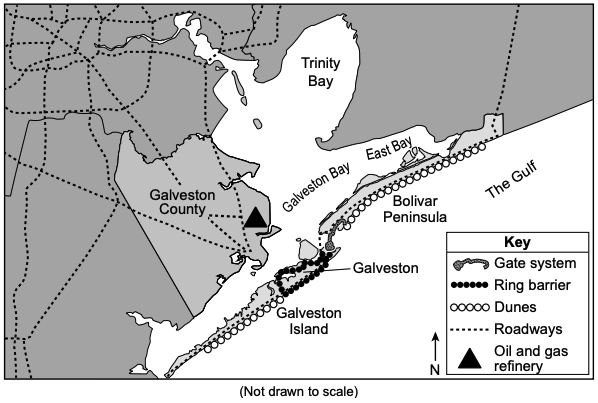
The coastal resort city of Galveston, Texas, transports the most cargo of any port in the United States. In between Galveston Island and Bolivar Peninsula is the Houston Ship Channel. This channel generates over $906 billion in commerce, mainly from oil and gas refineries in the area of Galveston County. For this reason, stakeholders have developed a plan to protect the region from hurricanes, storm surges, and flooding. The project is estimated to cost $34 billion. It will include a series of 36 sea gates to seal off Galveston Bay from storm surge. It also includes building large dunes (12 to 14 feet tall) to shelter housing, and a ring barrier to protect the business district.

Galveston Coastline Protection Project Map

Asemmisa {{asɛmmisaAhyɛnsode}}
34.

Changing atmospheric temperatures are predicted to cause the warm Loop Current to weaken. Which statement identifies a correct associated impact on the open Gulf water temperature and the transport of water westward along the shelf?

Asemmisa {{asɛmmisaAhyɛnsode}}
36.

Which statement correctly describes how one of the solutions in the project that mitigates damage from extreme weather events is able to sustain human population and protect biodiversity?

Asemmisa {{asɛmmisaAhyɛnsode}}
37.

Which two factors are mostly responsible for the changing global atmospheric and oceanic circulation patterns occurring in the Gulf?

Asemmisa {{asɛmmisaAhyɛnsode}}
39.

What is the most likely approximate Moon distance that occurred during the full Moon on December 15, 2024, based on information from the graph?

Asemmisa {{asɛmmisaAhyɛnsode}}
40.

Which statement correctly explains why the orbital velocity of the Moon at the supermoon position is different than at the apogee position?

Asemmisa {{asɛmmisaAhyɛnsode}}
41.

Calculate the date and local time in Plattsburgh, New York, when the next total solar eclipse with the same geometry is predicted to occur. Then, write yes or no to indicate whether this total solar eclipse will be observable in Plattsburgh, New York. Give a reason for your choice.

Date of total solar eclipse:
Time of total solar eclipse: p.m.
Observable in Plattsburgh, New York (yes or no):

Reason:

Base your answers to questions 42 through 46 on the information below and on your knowledge of Earth and Space Sciences. Some questions may require the use of the 2024 Edition Reference Tables for Earth and Space Sciences.

Hunga Tonga-Hunga Ha’pai Volcano

In January 2022, a submarine volcano named Hunga Tonga-Hunga Ha’pai (HTHH) caused the largest atmospheric explosion of the 21st century with the eruption column reaching a height of 58 km. Within the column, there were large amounts of liquid water and water vapor. The plume had layers of strongly enhanced water vapor that reached an altitude of between 19 and 28 km. The average ratio of water vapor at this level of Earth’s atmosphere is usually about 5 ppmv (ratio of the mass of water vapor to the mass of dry air). Twenty-four hours after the eruption, instruments attached to weather balloons measured water vapor ratios of 2900 ppmv. One recording station, Reunion Island, was still measuring ratios of 358 ppmv in the upper atmosphere one week after the eruption.

Water vapor plays a large role in climate feedbacks. Water vapor is the only greenhouse gas that will condense at temperatures present in the atmosphere. Water can be removed from the atmosphere by precipitation.

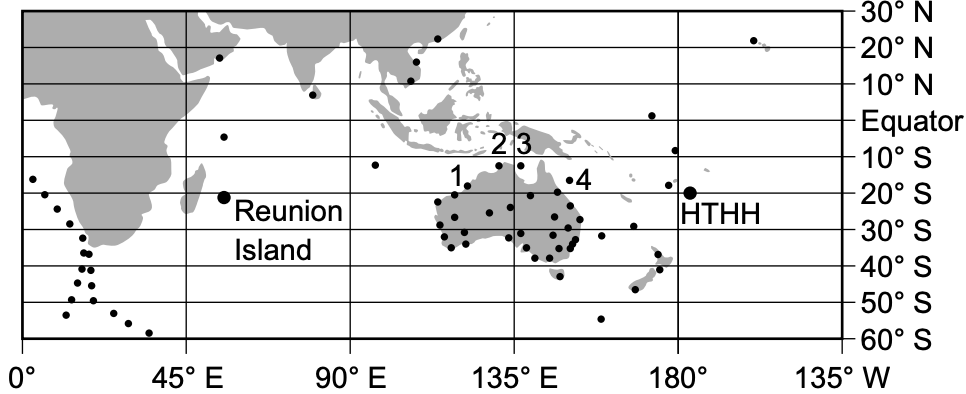
The map below shows the location of the undersea volcano, HTHH, and Reunion Island. Dots indicate locations where water vapor content data was collected.

Location of Hunga Tonga-Hunga Ha'pai and Reunion Island

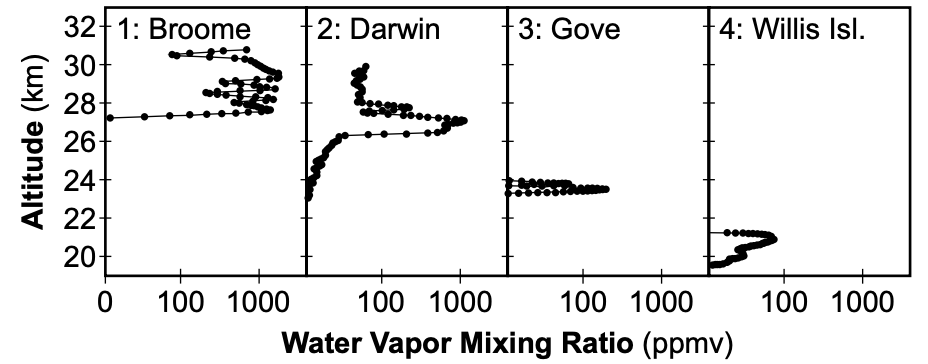
The table below shows some information about water vapor measured from different locations around Australia.

Altitudes of Water Vapor Detected from Weather Instruments 24 Hours After Eruption

Since the late 1800s, global average surface temperatures have increased by about 1.1°C. Data from satellites, weather balloons, and ground measurements confirm that as climate warms, the amount of atmospheric water vapor increases by 7% per degree Celsius. The graph below shows some information about global average temperatures based on the amount of fossil fuels used globally.

The Effect of Global Fossil Fuel Usage Scenarios on Global Average Temperatures (1850-2100)

Until a decrease in greenhouse gases occurs, creative ways to reduce climate change may be considered. One way is to make clouds thicker and brighter through a technique called “marine cloud brightening” (MCB). This process is shown in the model below. Arrows represent the direction of energy flow.

This method uses many ships that travel over large areas of the ocean. The ships spray seawater into the atmosphere, adding salt that acts as condensation nuclei. This creates thicker and brighter clouds that reflect additional solar radiation.

Model of Marine Cloud Brightening Process (MCB)

Asemmisa {{asɛmmisaAhyɛnsode}}
42.

Based on the geoscience information, which statement correctly describes how the volcanic eruption changed the amount of atmospheric water vapor at Location 2: Darwin?

Asemmisa {{asɛmmisaAhyɛnsode}}
43.

Which table identifies how the volcanic eruption of HTHH most likely affected the flow of energy to Earth’s atmosphere and identifies the highest atmospheric layer of peak water vapor content?

Asemmisa {{asɛmmisaAhyɛnsode}}
44.

The water vapor was moved by planetary wind circulation from the volcano to Reunion Island. Which row correctly matches the prevailing winds and the direction the water vapor moved?

Row

Planetary Wind

Direction of Movement

1

Northeast Trades

From west to east

2

Southeast Trades

From east to west

3

Westerlies

From west to east

4

Polar Easterlies

From east to west

Asemmisa {{asɛmmisaAhyɛnsode}}
47.

Which two factors are responsible for nucleosynthesis in a star?

Asemmisa {{asɛmmisaAhyɛnsode}}
48.

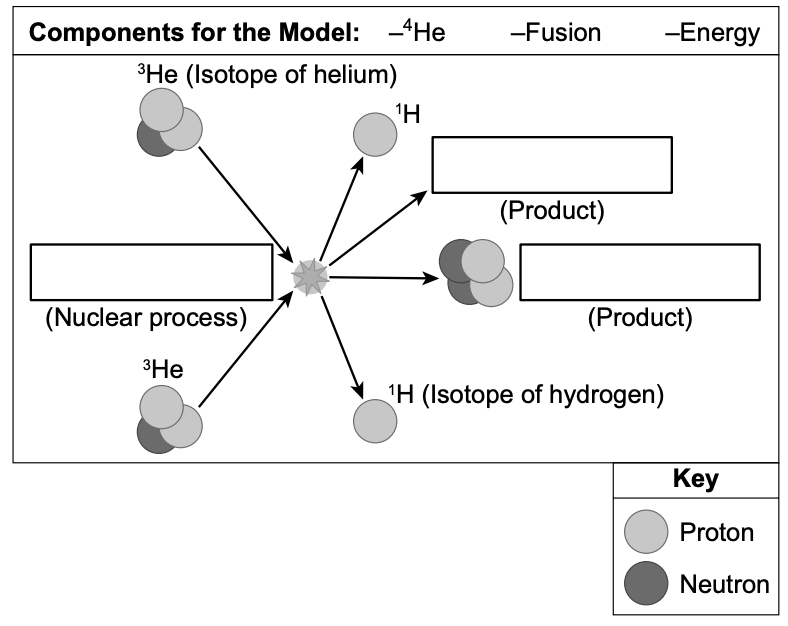
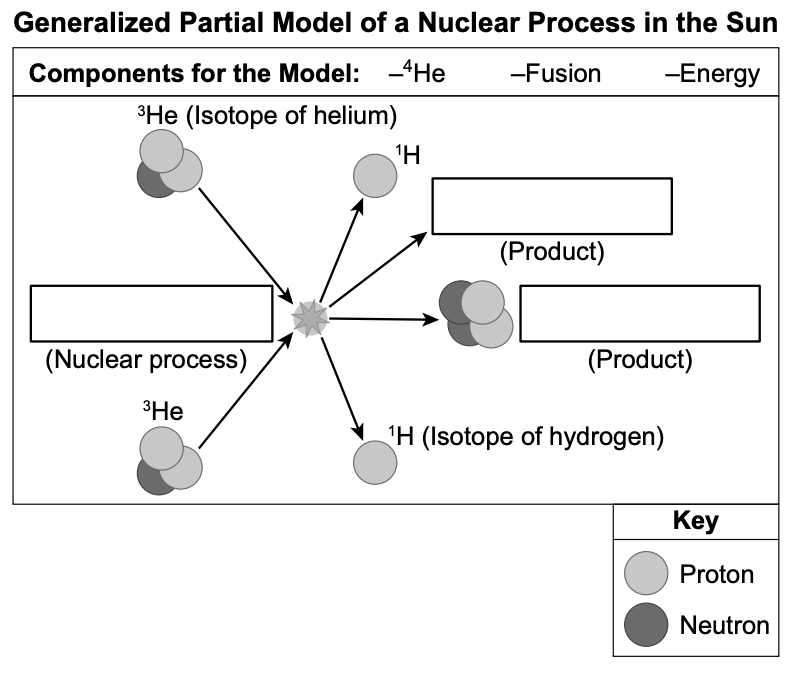
The model below shows some information about part of a nuclear process that occurs in the Sun. Some components of the model are missing. Complete the model by filling in the correct terms in the boxes from the components provided to illustrate the nuclear process that occurs in the Sun’s core and identifies the products.

Generalized Partial Model of a Nuclear Process in the Sun

Complete the model by filling in the correct terms in the boxes by dragging and dropping from the components provided ($^4\text{He}$, Fusion, Energy) to illustrate the nuclear process that occurs in the Sun’s core and identifies the products.

Mmuae Afoforo a Wobɛpaw:

Energy

$^{4}$He

Fusion

Asemmisa {{asɛmmisaAhyɛnsode}}
49.

Hubble’s work provided which piece of evidence that supports the Big Bang theory of an expanding universe?

Asemmisa {{asɛmmisaAhyɛnsode}}
50.

Which type of evidence or data did Hubble most likely use to measure the speed these galaxies were traveling?