Analyzing Charts and Graphs - Text Features
star
star
star
star
star
Posljednje ažuriranje over 7 years ago
10
Napomena autora:
Pie Charts, Circle Graphs, Bar Charts, Liine Graphs
0
0
0
0
0
0
1
1
0
0
Pie Charts, Circle Graphs, Bar Charts, Liine Graphs
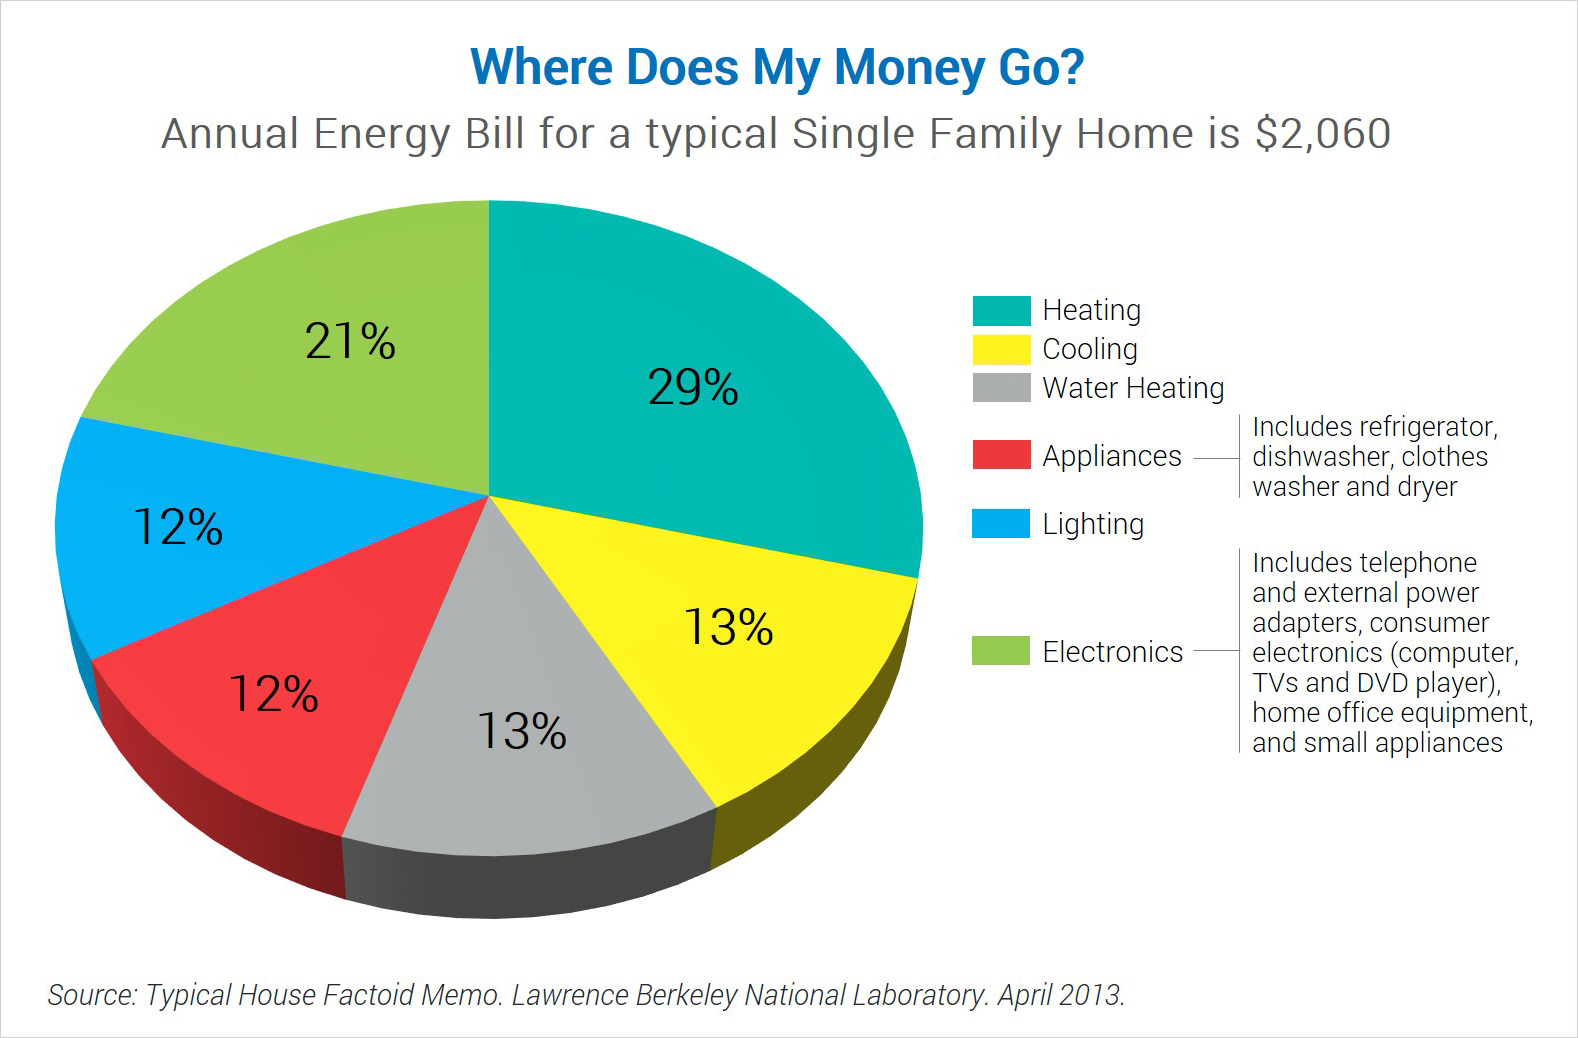
What type of chart or graph is this?
2) What are the different categories of spending that the graph shows?
3) In your own words, what does this graph show?
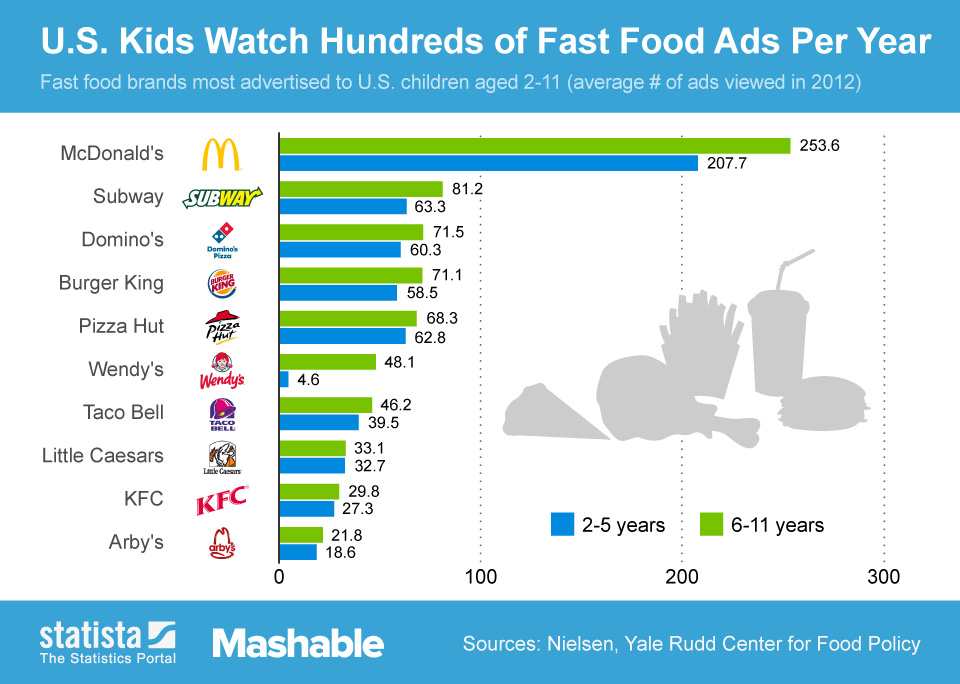
What type of chart or graph is this?
What does the Y axis represent?
What does the X axis represent?