10/30/17 Released Items
star
star
star
star
star
Posljednje ažuriranje over 7 years ago
29
Napomena autora:
Practice Algebra EOC
1
1
2
1
1
1
1
1
2
1
2
1
1
2
1
1
1
1
2
1
1
2
1
2
1
2
1
1
1
Practice Algebra EOC
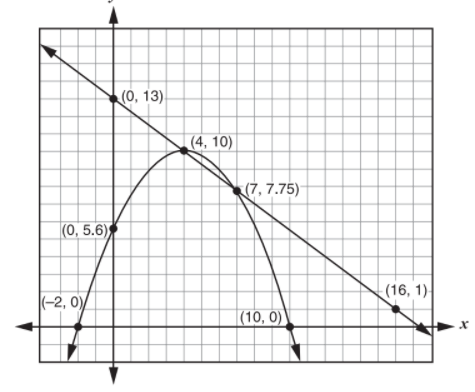
A system of equations is graphed below.
What are the solutions to the system?
Which of the following are factors of the equation when written in
factored form? Select all that apply.
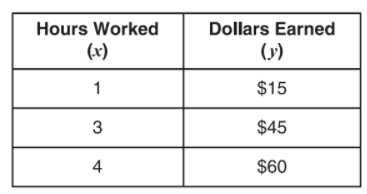
Kelli recorded the amount of money she earned, y, for hours
worked, x, in the table shown below. Select all that apply.
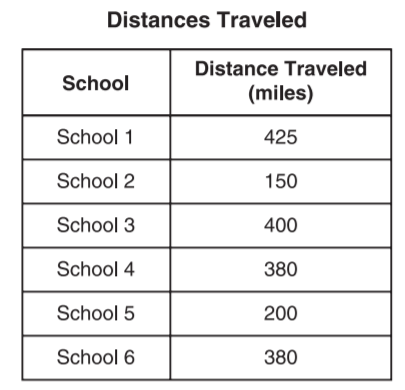
The table below shows the distances that schools will travel to attend a field trip to the state capitol. School 7 has to travel 15 miles. If this outlier is added to the data, which is a true statement about how it changes the data in the table? Select all statements that apply.
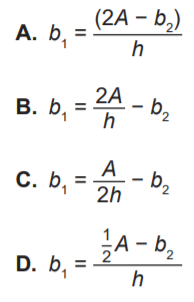
The formula for the area of a trapezoid is
Solve for bᵢ . See the image below to choose which equation is a correct value for bᵢ ?
The area, in square units, of a rectangle is represented by
If the width, in units, is 2x, what is the length, in units? Enter the expression that represents the length, in units, below.
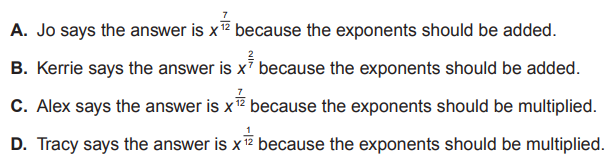
Which student correctly solved this expression?
See the image below to choose the correct answer.
Which of the following is the best method for solving?
Which ordered pair(s) satisfy the function below?
Select all that apply.
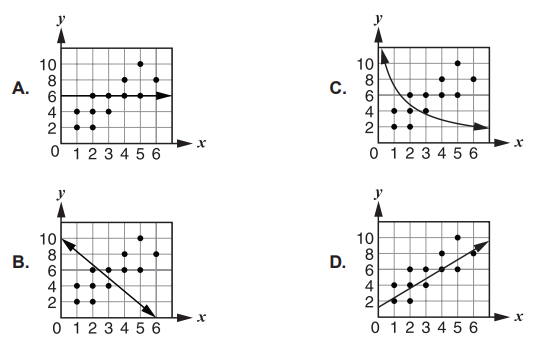
A residual is defined as the difference between the actual value of the dependent variable and the value predicted by the model. Which graph below best represents a relationship that minimizes residuals?
The ordered pairs in the table are possible solutions to the given equations. Match each ordered pair to the equation for which it is a solution. Ordered pairs may be used more than once.
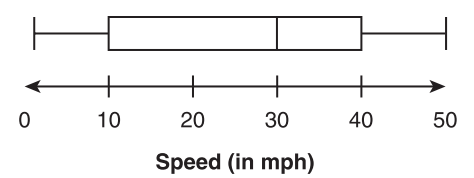
A police department captured 30 speeds on radar and organized their data in the box plot shown below.
What can be inferred from the data? Select all that apply
Which equation completes the square to create an equivalent to
in the form of
Which of the equations are represented by the graph shown below?
Select all that apply.
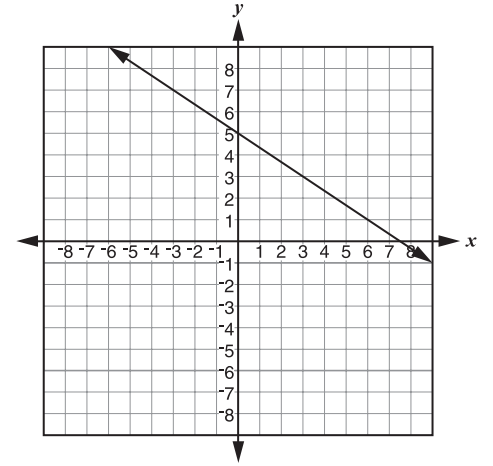
The graph of a linear equation is shown below.
What equation represents the graph shown?
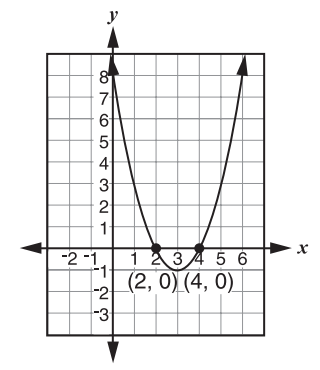
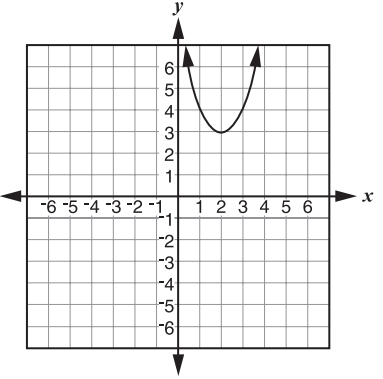
The quadratic function f(x) is shown in the graph below.
If the graph of f(x) is moved left 4 units and down 2 units, what would be the equation for the new graph in vertex form?
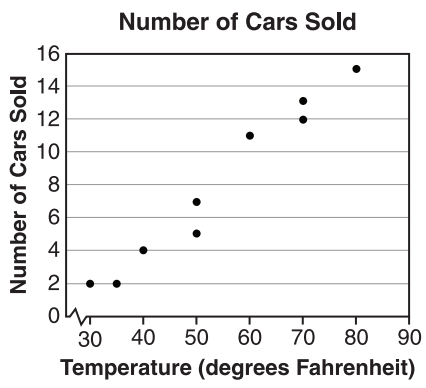
A car sales business is analyzing the number of cars sold and the average daily high temperature. The data is shown on the graph below.
Which statement is correct based on the data?
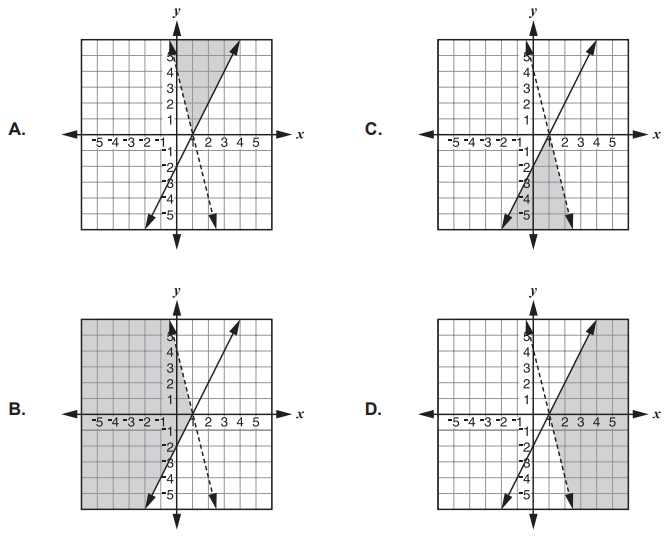
Select the graph that shows the solutions to the system of linear inequalities.
Select the letter of the images below.
The following question has two parts. First, answer Part A. Then, answer Part B.
Riley needs to save $300 for a computer. She gets an allowance of $10 a week and has already saved $75.
Part A: How many weeks, x, until Riley will have enough money to buy the computer?
Select the correct symbol to model the situation.
300 ______ 10x + 75
Part B: What is the value that is a solution to the situation in Part A?
Make sure you have selected an answer for both parts.
The following function was used to calculate the profit generated by selling T-shirts.
Let f(x) = 15x − 25 represent the profit function and x represent the number of T-shirts sold.
Which statement is true of f(200)?
Graph the inequality.
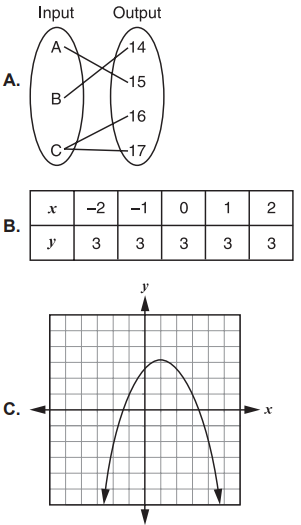
Which of the relations below represent functions?
Select all that apply.
A student graphs f(x) = x² and then graphs g(x) = x² + 5.
Select the word that correctly completes the sentence.
The graph of g(x) will be shifted _____ 5 units from the graph of f(x).
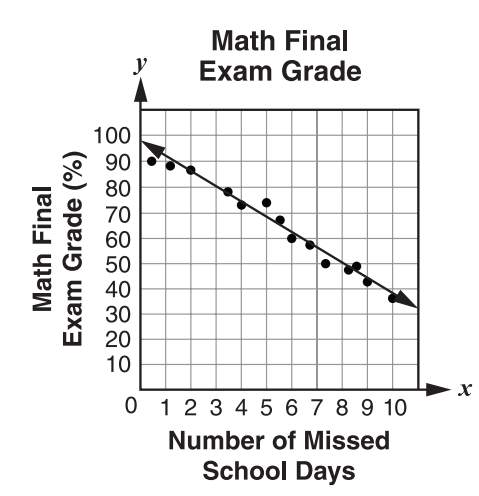
Draw a line from each function type to the function shown in each table.
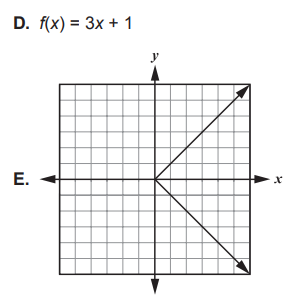
Which of the following statements describe the linear model shown below?
Select all that apply.
Compare f(x) = x² − 2x − 3 and g(x). Function g(x) is shown below.
Match the property with its corresponding function.
A property may match one function, both functions, or neither function.
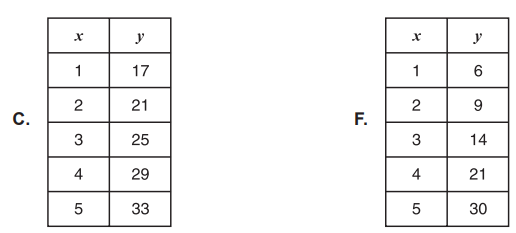
Which tables represent linear functions? Select all that apply.
The following question has two parts.
First, answer Part A. Then, answer Part B.
Johnathan is trying to solve the system of equations: y = −2x + 3 y = 1 2 x − 2
Part A Graph the system of equations.
Part B What is the solution to the system?
The following scatterplots show relationships between two variables.
Draw a line from the correct correlation coefficient to each graph.