Chapter 4-2: Shifts of the Demand Curve
star
star
star
star
star
Posljednje ažuriranje over 8 years ago
24 questions
Napomena autora:
Shifts of the Demand Curve
1
1
1
1
1
1
1
1
1
1
1
1
1
1
1
1
1
1
1
1
1
1
1
1
Shifts of the Demand Curve
When economists graph a demand curve they assume a condition referred to as ______________ _____________ . (2 words)
"Movement/change along the (demand) curve" occurs when the ONLY change is ____________ .
When price is the only thing that has changed in a market, economists refer to it as a "change in ___________ demanded."
If we assume ceteris paribus in a market then all changes must be _________ the curve.
When assuming ceteris paribus an economist means that the only thing that can possibly change in the market for a good/service would be ________________ .
Ceteris paribus, going from a price of $5 per unit to $2 per unit would lead to a change in _______________ __________________ . (2 words)
Which of the following would be the result of the change described in Question #6?
Which of the following is possible ONLY once we drop (get rid of) the ceteris paribus rule?
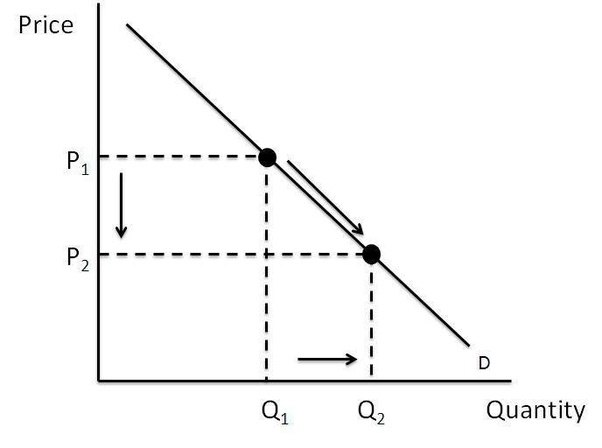
Which of the following is represented by the graph above?
Going from P1 to P2 in the graph above means that price has ________________ .
Going from Q1 to Q2 in the graph above is an ______________ in ________________ demanded.
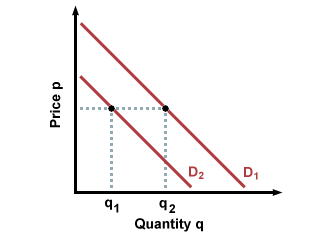
Going from D1 to D2 on this graph is considered
Assume that the graph above represents demand for Pancheros in Johnston. Which of the following would most likely explain what happened in moving from D1 to D2?
A good/service for which demand increases as income increases is considered a(n) _____________ good.
A good/service for which demand decreases as income increases is referred to a(n) ___________ good.
Coffee from which of the following would most likely be considered a normal good?
Which of the following would most likely be considered an inferior good?
The expectation of a sale on a good/service in the future is most likely to lead to which of the following right now?
An increase in population through birth or immigration will most likely lead to a(n) ________________ in demand .
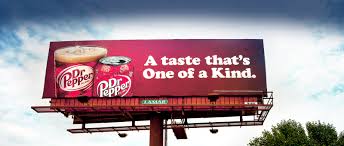
What is the most likely impact of this billboard?
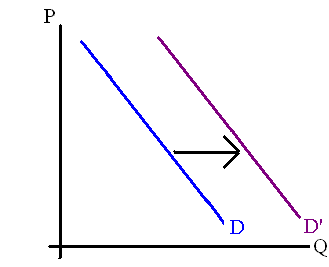
This graph represents a(n)
Which of the following would most likely lead to the (current) shift from D to D' (in the graph above) if the good/service were considered "normal"?
If two goods are "complements" they are bought and used ___________________ .
Pancheros and Chipotle would be considered ____________________ because if one of them raises their prices the other would likely see an _____________ in the demand for their products.