Line Plots with Fractional Amounts
star
star
star
star
star
Last updated over 8 years ago
12 Nsɛmmisa
1
1
1
1
1
1
1
1
1
1
1
1
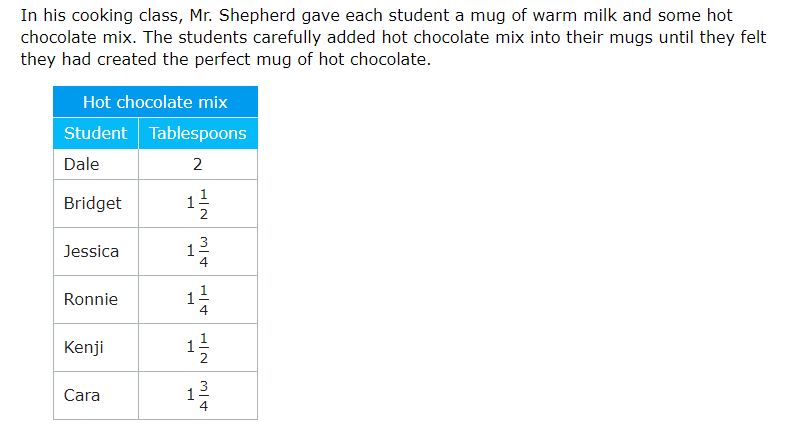
Use the data in the table to complete the line plot below.
How many tablespoons of hot chocolate mix are in the mug with the most hot chocolate mix?
Write your answer as a fraction, mixed number, or whole number.
How many mugs have at least 1 1/2 tablespoons of hot chocolate mix?
How much more hot chocolate mix was used in the mug with the most hot chocolate mix than in the mug with the least hot chocolate mix?
Write your answer as a fraction, mixed number, or whole number.
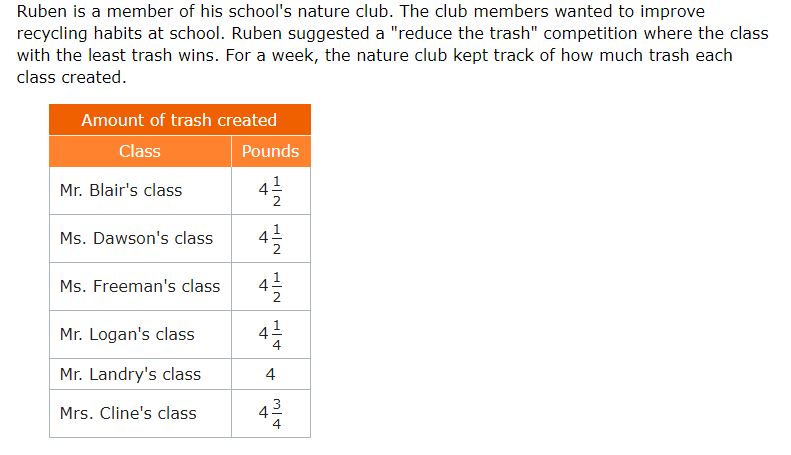
Use the data from your table to complete the line plot below.
How many classes created more than 4 pounds of trash?
How many classes created more than 4 but less than 4 3/4 pounds of trash?
How much more trash was created by the class with the most trash than the class with the least trash?
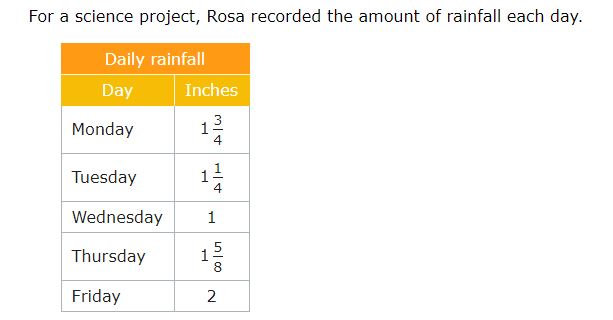
Use the data from the table to complete the line plot below.
On how many days did it rain more than 1 1/2 inches?
How many days had more than 1 1/8 inches but less than 1 3/8 inches of rain?
How much total rainfall was there?