Quadratic Function Features
star
star
star
star
star
Last updated over 8 years ago
6 Nsɛmmisa
2
2
2
2
1
1
How does the value of a in the function affect its graph when compared to the graph of the quadratic parent function?
How does the value of a in the function affect its graph when compared to the graph of the quadratic parent function?
SELECT ALL THAT APPLY.
How does the value of a in the function affect its graph when compared to the graph of the quadratic parent function?
SELECT ALL THAT APPLY.
How does the value of a in the function affect its graph when compared to the graph of the quadratic parent function?
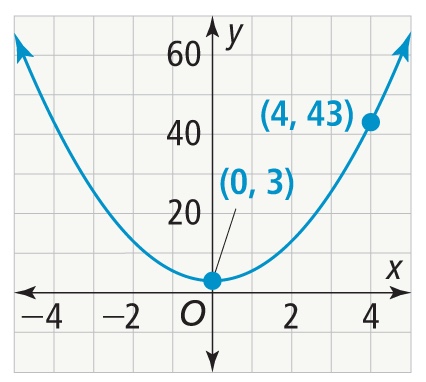
Based of the image above.
Given the function
find the average rate of change over the interval 𝟢 ≤ 𝘹 ≤ 𝟦. What does the average rate of change tell you about the function?
At the end of the lesson or question 5, I can say that I am able to identify the key features of the graph of a the quadratic parent function.