Formative: Food Webs and Energy Flow
star
star
star
star
star
Posljednje ažuriranje almost 8 years ago
11
1
1
1
1
1
1
1
4
1
1
1
If a bird eats a mouse that eats grass, the bird is a(n)
Which of the following shows a correct food chain?
The first organism in a food chain is typically a(n)
In an energy pyramid, which level has the most available energy?
The many overlapping food chains in an ecosystem make up a(n)
The movement of energy in an ecosystem can be shown by an energy pyramid. An energy pyramid shows the amount of energy available at each level of a food chain. A food chain is made up of grain plants, mice, snakes, and hawks. Which of the following diagrams correctly represents the energy available at each level in this food chain? [https://www.quia.com/files/quia/users/jpaydo/energy-pyramid.jpg]
What most likely caused the rabbit population to decrease during the first month shown in the graph above?
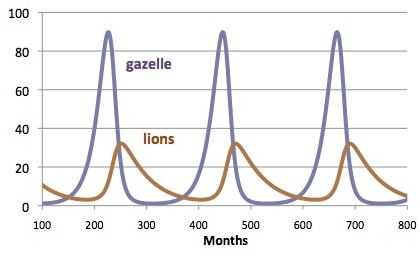
In one or two sentences, please summarize what the graph is telling you about gazelles and lions. (The Y-axis is the "Number of Individuals" in that ecosystem). Use specific numbers to add detail to your summary.
Looking at the model above, if the hawks are increased, what will happen to the grass? Please explain your reasoning.
Describe the role of decomposers in an ecosystem.
After our lessons on food chains, predator-prey relationships (graphs) and videos in class, name and describe one way you could increase biodiversity in an ecosystem.