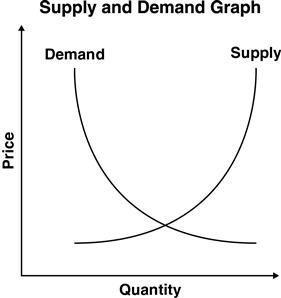
How would this graph MOST likely change if the price of a complementary good were to increase?
A
The demand curve would shift to the left.
B
The demand curve would shift to the right.
C
The supply curve would shift to the left.
D
The supply curve would shift to the right.