1
Asemmisa {{asɛmmisaAhyɛnsode}}
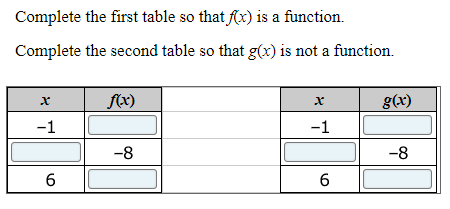
1.
1
Asemmisa {{asɛmmisaAhyɛnsode}}
2.
1
Asemmisa {{asɛmmisaAhyɛnsode}}
3.
1
1
1
Ohio Algebra I AIR test practice
(This question references the graph above)
Juan wants to rent a house. He gathers
data on many similar houses. The
distance from the center of the city, x,
and the monthly rent for each house, y,
are shown In the scatter plot. Juan
models the data with a linear equation.
Based on the scatter plot, what could
the number 1275 represent in his
equation?
Function f(x) undergoes a single transformation to create function g(x). The graphs of both fix) and g(x) are shown.
Create g(x) in terms of f(x).
A scientist is studying wildlife. She estimates the population ofbats in her state to be 270,000. She predicts the population to grow at an average annual rate of 2.9 percent.
Using the scientist's prediction, create an equation that models the population of bats, y, after x years.
What is the factored form equation of f(x) = x²+2x-3?
Graph f(x) = x²+2x-3 in the Desmos window provided. In line 2 and 3, graph the x-intercepts as an ordered pair (x,y) and in line 4 graph the maximium or minimum as an ordered pair.
Fred solved the equation 8(3x - 7) = -6(x + 7) + 4 as shown.
Fred made an error between Step 1 and Step 2
A. Explain the error that Fred made.
B . What is the solution to the original equation?
Type your answers in the space provided.
A system of equations is shown.
y=3x-2
y=x²
What are the solutions to the system of equations (use the lines in Desmos after you graph the system to put your answers as ordered pairs (x,y)?
Ms. Musto opened a new coffee shop. She
recorded the number of customers she
served between opening and noon for the
first 20 days of business. Her results are
shown on the graph.
Which line best fits the data?
A linear model shows that the relationship between the number of grocery items purchased and the total cost of the grocery bill has a correlation coefficient of 0.97
Which statement about the variables is true?