Analyzing Extinction Data
star
star
star
star
star
Posljednje ažuriranje about 8 years ago
3 questions
2
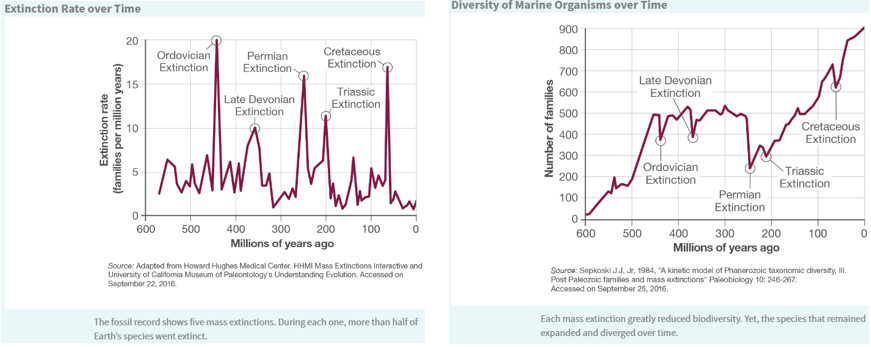
Describe the trends you see in each graph. What is the relationship between mass extinctions and biodiversity over time?
Describe the trends you see in each graph. What is the relationship between mass extinctions and biodiversity over time?
2
Does the Extinction Rate over Time graph provide evidence that extinctions are a normal part of Earth’s history? Explain your reasoning.
Does the Extinction Rate over Time graph provide evidence that extinctions are a normal part of Earth’s history? Explain your reasoning.
1