Genetics Test HN
star
star
star
star
star
Last updated about 7 years ago
38 Nsɛmmisa
1
1
1
1

1
1
1

1
1
1
1
1
1
1
1
1
1

1
1
1
1
1
1
1
1
1
1
1

1
1
2
2
2
1
1
2
2
8
Which genotype below is heterozygous?
An organism’s expressed physical trait, such as seed color, is called its:
If the allele for green pea pod color (G) is dominant over the allele for yellow pea pod color (g), which of the following genotypes would a plant with yellow pods have?
In corn plants, green (G) is dominant to yellow (g). What is the chance of two heterozygous corn plants producing yellow corn plants?
What information is revealed in the portion of the karyotype above?
Which of the following describes an organism that has the genotype Bb?
Genes located on homologous chromosomes may have alternate forms that control different forms of a trait. These alternate forms of a gene are called _____.
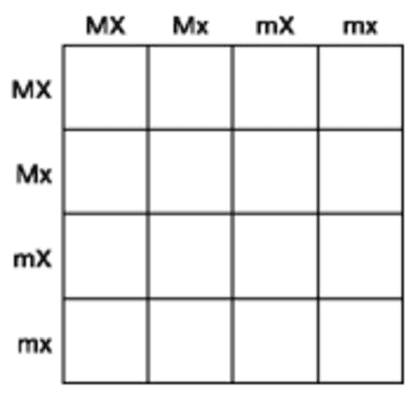
What is the genotype in the bottom left-hand quadrant in the Punnett square shown above?
A trait carried on the X or Y chromosome is said to be ________ inheritance.
The alleles contained in _____ produced by each parent are shown along the sides of a Punnett square.
A useful device for predicting the possible offspring of crosses between different genotypes is the _____.
Mendel's law of segregation states that during meiosis, the factors that control each trait separate and only _____ from each pair is/are passed to the offspring.
A couple has two children, both of whom are boys. What is the chance that the parents' next child will be a boy?
How should the TOP ROW of the figure above read?
What fraction of the cross shown above will be recessive for both traits?
The type of inheritance shown when a red-flowering plant is crossed with a white-flowering plant and only pink-flowering plants are produced is _____.
The 23rd pair of chromosomes that differ in males and females are called _____.
If individual III-2 marries a person with the same genotype as individual I-1, what is the chance that one of their children will be afflicted with hemophilia?
What type of inheritance pattern does the trait represented by the shaded symbols in the figure above illustrate?
For the trait being followed in the pedigree, individuals II-1 and II-4 in the figure above can be classified as _____.
What is the relationship between individual I-1 and individual III-2 in the figure above?
An individual of phenotype XBXB marries an individual whose phenotype is XbY. What proportion of their male children will be colourblind?
When red and yellow spotted beetles are mated, 25% of the offspring are red, 50% are red and yellow spotted, and 25% are yellow. This trait is one controlled by _____.
Because the gene for red-green colour-blindness is located on the X chromosome, it is not possible for a:
A dominant phenotype must have at least _____ dominant allele(s) present in the parent(s).
A man heterozygous for blood type A marries a woman heterozygous for blood type B. The chance that their child will have type O blood is _____.
A student researching new information for his Genetic disorder brochure could find the most current AND reliable information in a:
Which domain includes organisms whose cells have a nucleus?
This food chain can be found in the coastal waters of Virginia. The population of which organisms in the food chain would be the FIRST to decline if shrimp populations decrease due to overfishing?
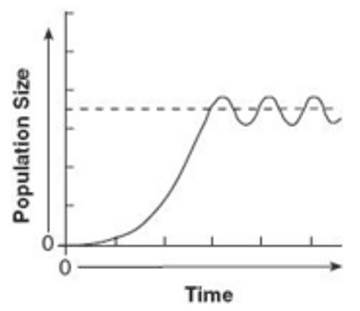
The graph below shows the changes of the size of a fish population over a period of time. The dashed line on the graph represents the:
Refer to the family described above. Will the boy definitely be colour-blind? Explain why or why not. (2 pts)You will create the Punnett square to support your explanation in #32.
Create a Punnett square to support your explanation in #31. (2 pts)Use the largest text possible.
Create the Punnett square for the family described above. (2 pts)Use the largest text possible.
What are the odds that the child from the family described above will have blood type A? (1 pt)
What are the odds that the child will express the codominant blood type? (1 pt)
The couple finds out the child’s blood type is O. Is the child biologically theirs? Explain. (2 pts)
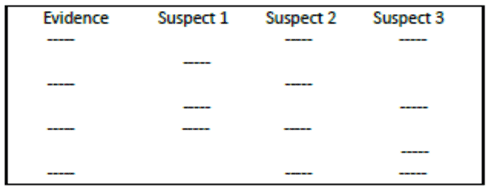
As usual, some chucklehead in Mr. Ferzoco’s class left their worksheet behind. Luckily, they were picking their nose. After collecting DNA from the sample and creating a profile, the following DNA fingerprint gel was run. Which criminal (oops, student) committed the crime AND why? (2 pts)
Two parents are heterozygous for the widow’s peak hairline and heterozygous for unattached earlobes. Give the phenotypic probabilities of their offspring. Show all steps of your work. (8 pts)Use the largest text possible.