Stephanie expects to earn $10.00 for every hour she works at Chick-fil-a this summer, but at the end of the summer she will have to pay her parents $350.00 for using the car.
Which equations models how much money (M) Stephanie will have at the end of the summer if she works for (h) hours and paid her parents?
4 points
4
Question 2
2.
Dan is filling up his water bottle at the drinking fountain. The water flows from the fountain at a rate of 6 ounces per second. His bottle had 10 oz. of water in it when he started to fill it. This scenario can be modeled with the equation W = 6t + 10 where W is the amount of water in the bottle (in oz.) and t is the time spent filling the bottle (in seconds).
How many ounces of water will Dan have in his bottle after filling it for 8 seconds?
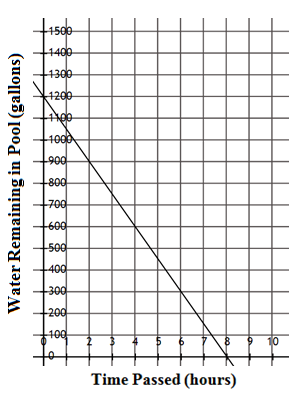
Arty is draining his pool. He created a line of fit for the data he gathered and graphed it.
The equation of the line of fit is W = -150h + 1200, which represents how much water was left in the pool in relation to time passed.
Use this graph and equation to answer questions 3 - 5.
4 points
4
Question 3
3.
What does the y intercept mean, in context?
4 points
4
Question 4
4.
According to the line of fit, how many hours will it take for the pool to be completely drained?
4 points
4
Question 5
5.
What does the slope of the line of fit mean, in context?
4 points
4
Question 6
6.
Identify the y - intercept of the graph below.
4 points
4
Question 7
7.
Which of the following statements is true about the graph?
4 points
4
Question 8
8.
Solve for x.
4 points
4
Question 9
9.
Find the slope of the line.
4 points
4
Question 10
10.
Solve for x.
4 points
4
Question 11
11.
Solve for x.
4 points
4
Question 12
12.
Solve for x.
4 points
4
Question 13
13.
Solve for x.
4 points
4
Question 14
14.
Solve for x.
4 points
4
Question 15
15.
Solve for x.
4 points
4
Question 16
16.
Romina is tracking the growth of her saguaros by comparing the current height in millimeters to the time they have been planted in months. Romina’s data is displayed in the graph below with the line of best fit.
The correlation coefficient of Romina's line of fit is 0.982. What does this tell us about the data?
4 points
4
Question 17
17.
The equation of Romania’s line of fit is y=10x+31. What does the slope of Romina’s line of fit mean, in context?
4 points
4
Question 18
18.
The equation of Romania’s line of fit is y=10x+31. What does the y intecept of Romina’s line of fit mean, in context?
4 points
4
Question 19
19.
Simplify:
4 points
4
Question 20
20.
What inequality does the graph represent?
4 points
4
Question 21
21.
What graph represents the following inequality?
4 points
4
Question 22
22.
Which graph represents the following inequality?
4 points
4
Question 23
23.
Solve the following system of linear equations.
4 points
4
Question 24
24.
Solve the following system of linear equations.
4 points
4
Question 25
25.
Which of the following system of linear equations has a solution of (2, 4)?