Human Genetics Lab
star
star
star
star
star
Posljednje ažuriranje about 7 years ago
40
0
0
0

5
1
1
1
3
1
5
1
1
1
1
1
1
1
1
3
4
4
4
4
4
4
6
4

4
4
4
4
1
1
5
1
5
1
1
1
1
Last Name, First Name
Class Period:
Date:
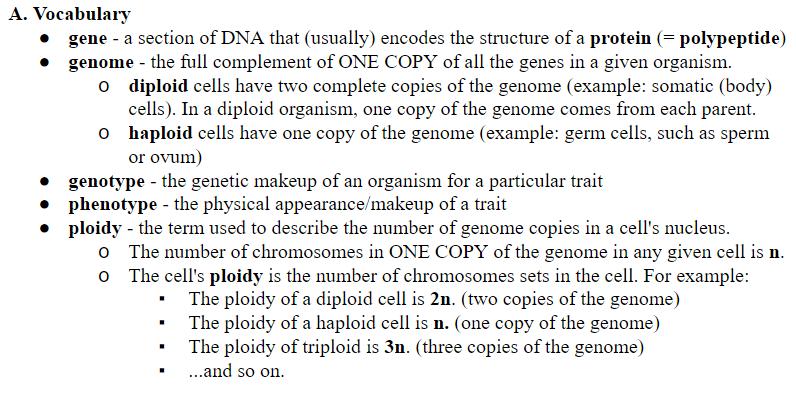
B. Two Types of Chromosomes
The sex of an individual organism can be determined in a number of different ways, depending on its species. For now, we will concentrate on mammals, in which sex is determined by the complement of two sex chromosomes, the X and Y. As you probabaly already know, female mammals have two X chromosomes, and males have an X and a Y. While the X chromosome is relatively large and carries many genes, the Y chromosome is comparatively quite small. Most of the genes it carries are involved in the determination of maleness.
Genes located on either the X or the Y chromosome are said to be sex-linked (or, more specifically, X-linked or Y-linked). Because males have only one X chromosome, any X-linked alleles they carry on that X chromosome will be expressed. They do not have another homologous allele on the Y to mask it. Hence, males are more likely than females to express X-linked recessive traits.
Chromosomes other than the X and Y chromosomes are known as autosomes. Traits encoded by genes located on autosomes are known as autosomal traits.
Record your individual data as well as the class numbers for color blindness and left-handedness.
Did the class totals for males having a color deficiency match the expected ratios?
Did the class totals for females having a color deficiency match the expected ratios?
Did the class totals for color deficiency match the class totals for left handedness?
Choose all statements that may explain why the class data on color deficiency did not meet expected ratios.
Select the best statement that would predict/explain how a male gets a sex-linked trait of color deficiency.
Procedure:
Collect individual data for yourself and then share your individual data with the class for class totals. Follow this procedure to find out which compounds you can taste:
1. Take one control taste test strip from the container marked “Control”. Place the taste strip on your tongue. Be sure to test all regions of your tongue. You should not taste anything. If you taste something, it should taste like paper. Remember what it tastes like. Remove the taste test strip from your mouth, and place it on a piece of toweling so you don’t get your saliva on the table top. Please do not place it on your lab table.
2. Take one PTC taste test strips from the container marked “PTC”. Place the taste strip on your tongue. Be sure to test all regions of your tongue. Do you taste anything? A bitter taste should occur for tasters and nothing for non-tasters. Remove the taste test strip from your mouth and immediately place it on the toweling. Do not place it on your lab table top. Record whether or not you taste PTC in your chart. If you tasted nothing, or if it tasted the same as the control test, you are a non-taster. Otherwise, you are a taster.
The taste dimorphism in sensitivity appears to hinge on a pair of genes. Individuals having the homozygous recessive gene are non-tasters. About 70% of the population will detect the taste. There are differences due to race. In the North American caucasian population about 20% are homozygous tasters, 50% are heterozygous tasters, and 30% are non-tasters.
3. Repeat the same steps for the Thiourea taste test strip. Record whether or not you taste Thiourea in your chart. If you taste it, you are a taster. If you did not taste anything, than you are a non-taster. Remove the taste test strip from your mouth and immediately place it on the toweling. Do not place it on your lab table top
4. Repeat the same steps for the sodium benzoate taste test strip. Record whether or not you taste sodium benzoate in your chart. Remove the taste test strip from your mouth and immediately place it on the toweling. Do not place it on your lab table top.
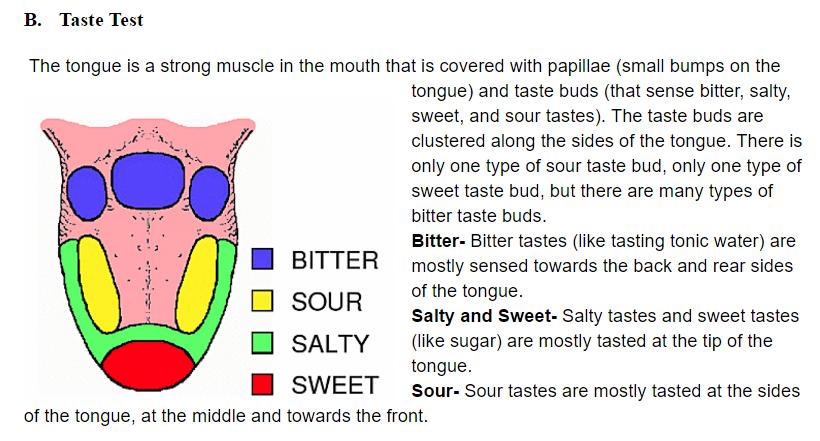
If tasted, record whether you tasted something sweet, salty, sour, or bitter. You may taste more than one. Put a check in any box that you can taste and then put the total number of flavors you can taste in the “Total Taste” column.
Take your toweling with all your used taste strips and throw them away before doing your calculations.
5. Tally class data and then answer the questions on your worksheet.
Comments: While PTC does not occur naturally in foods, chemically similar compounds do. It has been found that food preferences are correlated with the ability to taste (or not taste) PTC (Forrai and Bánkövi, 1984). Now that you know what PTC tastes like (even if it’s only from the expressions of disgust on your taster lab partner’s face), what might be the evolutionary/adaptive significance of this trait? Now that we’ve told you that PTC-tasting is a monogenic trait, we must be more honest with you. Recent research has suggested that there may be at least two loci involved in the expression of this trait (Drayna, et al. 2003). Further research may some day explain how this might explain why some tasters have an extremely strong, negative reaction to PTC, while others report a relatively mild bitter taste.
If needed, clean-up before going to the next section: Be sure your area doesn't have used “taste strips” on the table or floor. Be sure they are put in the trash. If necessary clean your table with a wet wipe.
Complete the Table with your individual results and the class data.
In general, could those tasting PTC also taste thiourea?
In general, could those tasting PTC also taste sodium benzoate?
Based on the data, describe whether your class has a lot of tasting variety (diversity).
If you/or your classmates are tasters, what are your possible genotype(s)?
If you or your classmates were non-tasters, which statement can not be true about your/their parents?
If both of your parents were tasters and you tested as a non-taster, what is the probability that your sisters and/or brothers are also non-tasters like you.
If you were a non-taster, what is the possible taste allele(s) that you could have in one of your gametes (egg or sperm)?
Since the PTC tasting trait is autosomal, what would you predict about the expression of the trait in males versus females?
II. Simple autosomal human traits
Relatively few phenotypic traits are controlled by a single gene. However, it was only by studying these monogenic traits that Mendel was able to discover the basic workings of inheritance. He studied such things as flower petal color and fruit characteristics in the edible pea (Pisum sativum). But we can now extrapolate Mendelian genetics to some monogenic traits expressed by Homo sapiens. The following section describes some easily recognizable human traits. Some are entirely monogenic, and some are influenced by factors other than a single gene.
Part C. Human trait characteristics:
1. Use the information about the specific trait following these instructions to determine whether you are dominant or recessive for this trait. In some cases you may find it necessary to have a partner confirm your opinion as to whether a suspected trait is being fully expressed or not. Record your personal information for each trait by entering it in Column I on your data collections sheet.
2. Your class with the assistance of your teacher will keep a record of the class' distribution of traits. After each test below, share your phenotype so that your data can be included in the table and shared with the entire class prior to calculating frequency of the different alleles. The total of classmates with/without the trait are put in Column III.
3. Frequency calculations are made and entered into Column IV in the chart using the class data. To find “frequency” divide the total number of students in the class by the total number of students in Column III with the trait. This needs to be a decimal number so it can be compared with expected frequency in Column V.
4. Compare the class data (Column IV) against the expected ratios in Column V. If the class frequency is greater than the expected, put the math term for greater than ">" in Column VI. If the class frequency is less than the expected ratio, then put the math term for less than "<" in Column VI. If the class frequency and expected ratios are close to the same numbers, then put an "=" in Column VI.
You need to know the total numer of students in the class as well as the total number of females and males. Insert these numbers here so you will have them later for calculating the frequency of the expression of the traits in your classroom population. List numbers in this order: Total, Females, Males
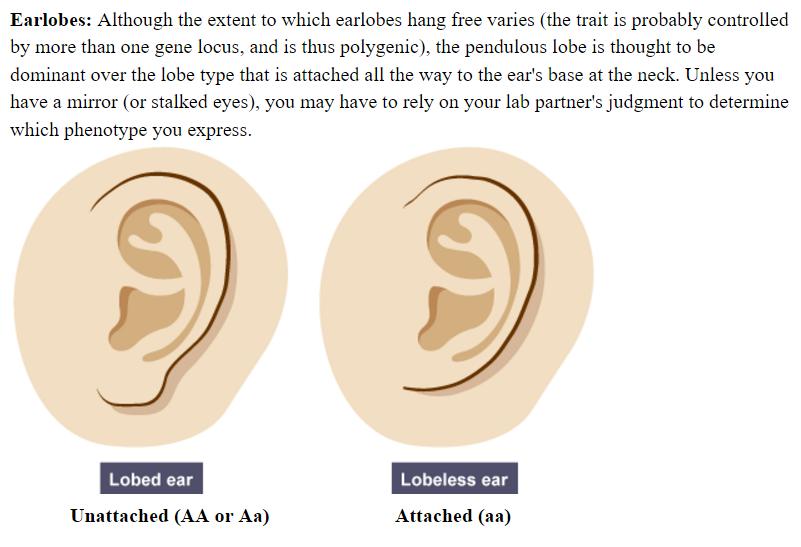
#1 Ear Lobes: Record your individual data and the class data in the Table.
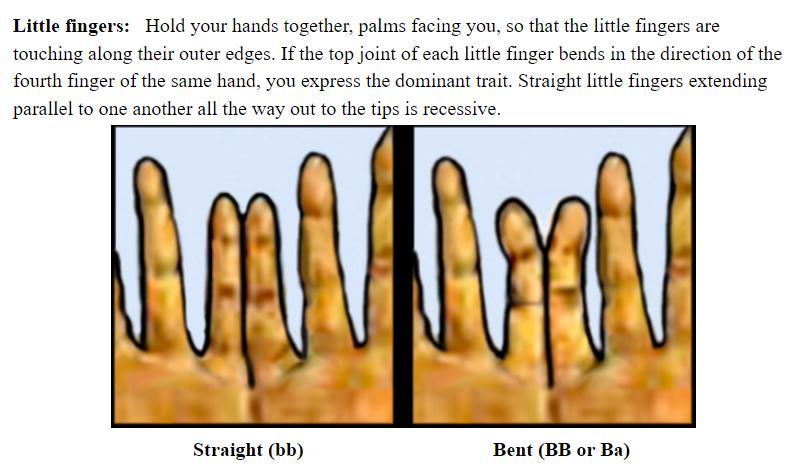
#2 Little Fingers: Record your individual data and the class data in the Table.
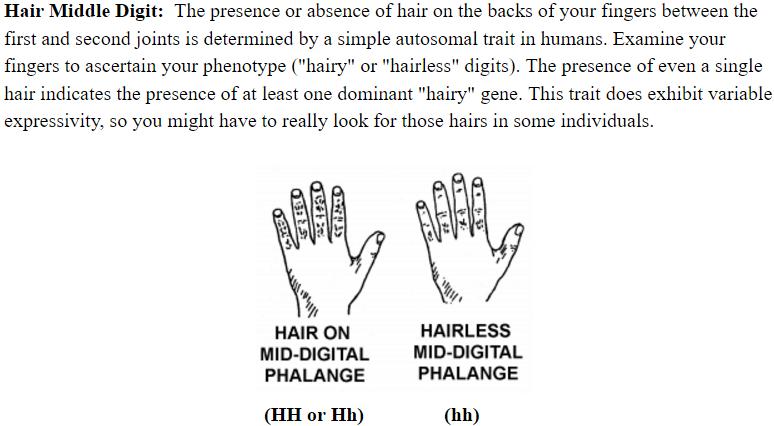
#3 Hair Middle Digits: Record your individual data and the class data in the Table.
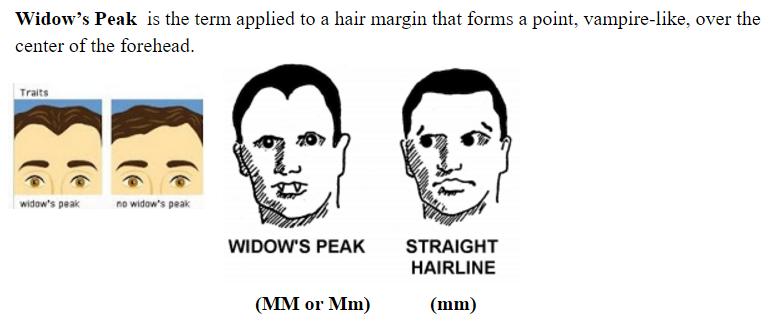
#4 Widow's Peak: Record your individual data and the class data in the Table.
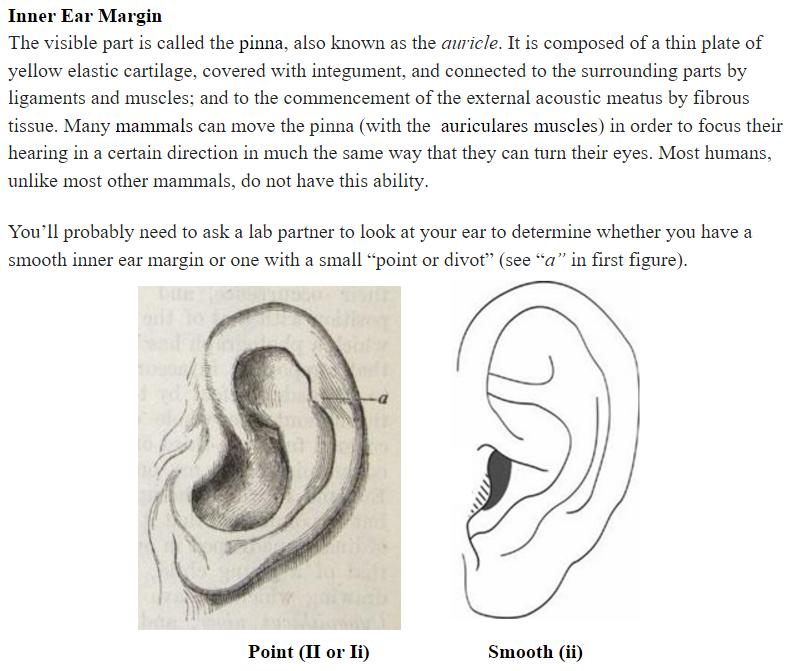
#5 Inner Ear Margin: Record your individual data and the class data in the Table.
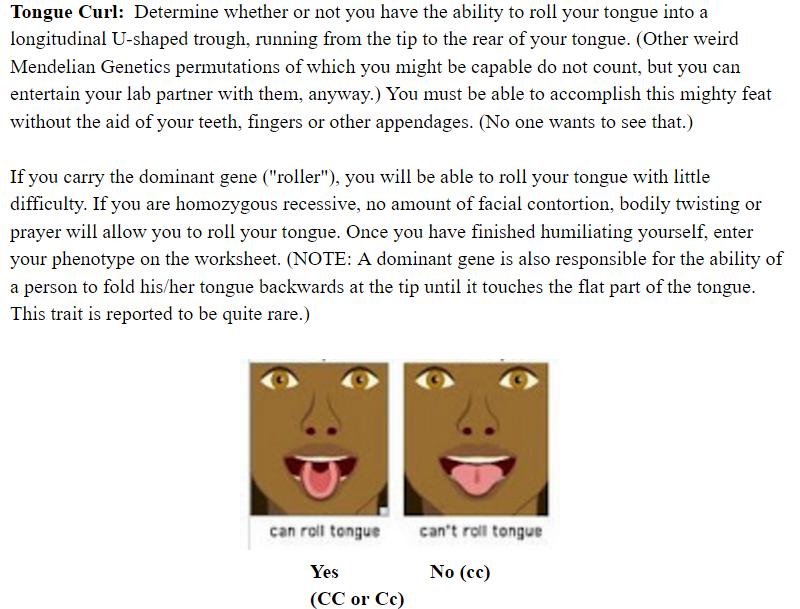
#6 Tongue Curl: Record your individual data and the class data in the Table.
#7 INDEX FINGER:
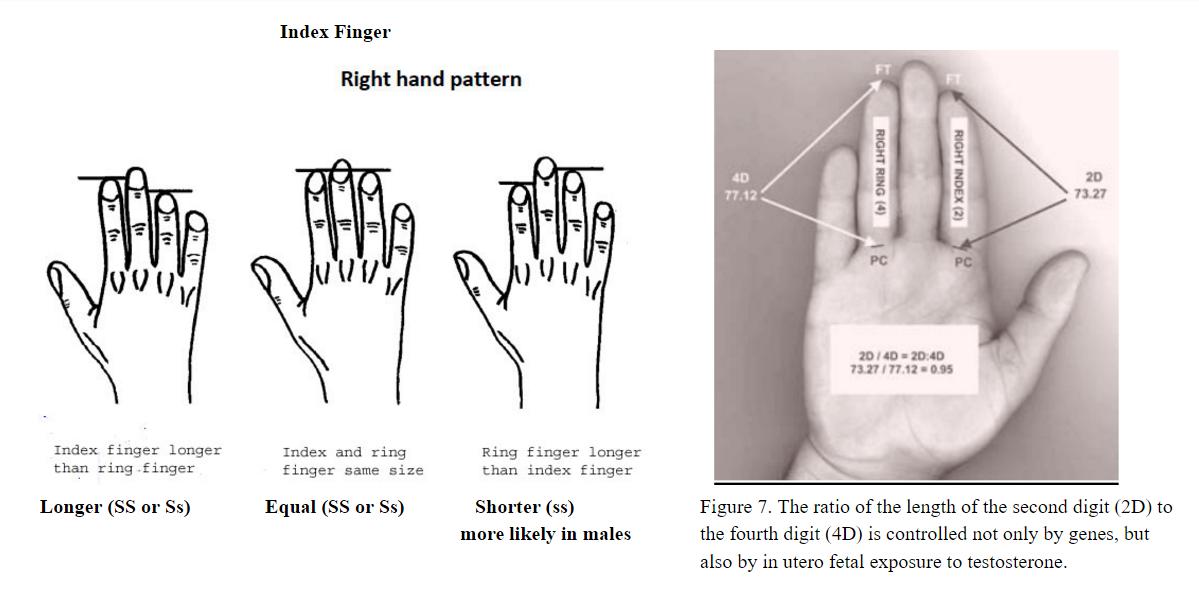
Place your fingers flat on your lab table. Now observe your index finger (2D) and ring finger (4D). Are they the same length? Is the index finger shorter (low 2D:4D ratio)? Is the index finger longer (high 2D: 4D ratio)? The second digit (2D) to fourth digit (4D) ratio (Figure 7) is believed to be a sex influenced trait.
This trait is autosomal, but its expression depends on the sex of the individual, and specifically upon the level of androgens (male hormones) to which the individual was exposed during a critical time in fetal development. Although the ratio appears to have predictable heritability, its exact expression varies among individuals with the same genotype for the trait. This is an example of variable expressivity, this time influenced by sex hormones. Males are more likely to have a low 2D:4D ratio (index finger shorter) than females, who tend to have index and ring fingers of the same length, or with a slightly longer index finger. A great deal of fascinating research has shown that the 2D: 4D ratio can be a predictor of the effects of fetal testosterone exposure on the brain and future behaviors.
Use the millimeter rulers available on the lab tables to measure your 2D:4D ratio. And don’t panic if it’s not what you expect. Just start to read the vast literature on this topic, and prepare to be amazed.
#7 Index Finger: Record your individual data and the class data in the Table.
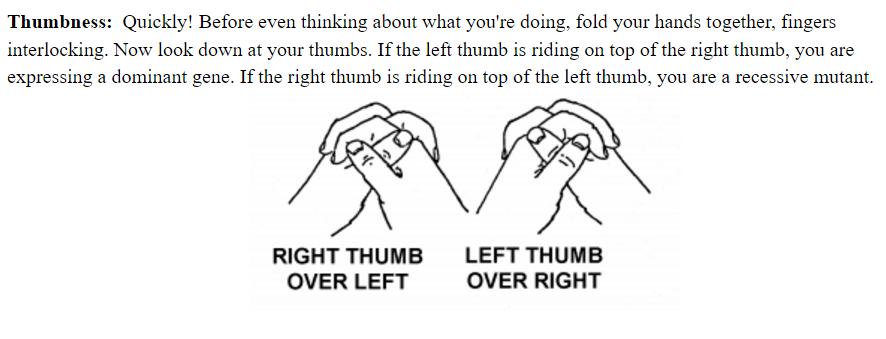
#8. Thumbness: Record your individual data and the class data in the Table.
#9 Toe Length: Record your individual data and the class data in the Table.
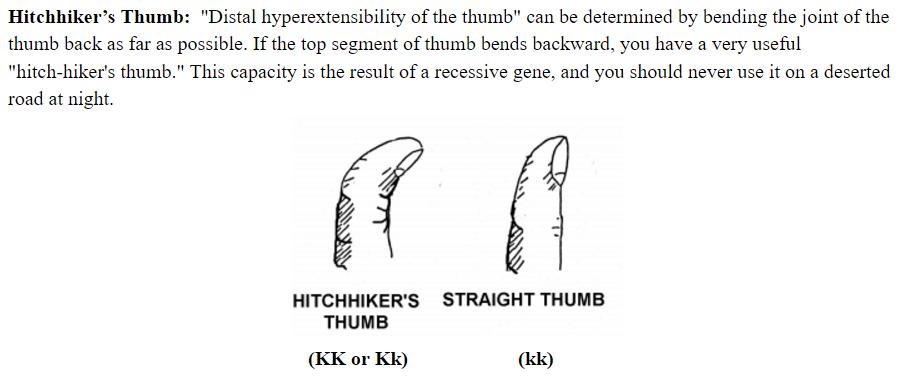
#10 Hitchhiker's Thumb: Record your individual data and the class data in the Table.
#11 Hair Color (Natural, not dyed) - Light (dd) Dark (DD or Dd)
Mammals produce two main types of melanin pigment that color the skin and hair. Eumelanins produce brown to black coloration, while pheomelanin is responsible for reddish and yellowish hues. As many as twelve different gene loci are known to affect variation in human hair color, probably by affecting the degree of deposition of each pigment in the hair shaft.
Cells known as melanocytes are responsible for pigment deposition in the non-living hair shaft, and it is these cells that provide pigment in the skin and some other tissues, as well. Eumelanin concentration generally determines how dark the hair color is. Blonde hair indicates a low deposition of melanin, and the different shades of brown result from increasing amounts of the brown eumelanin in the hair shaft. A darker version of eumelanin is responsible for black hair when it is present in the hair shaft in very high concentrations.
As the hair follicles produce less eumelanins with age, the hair begins to turn gray, and finally white. Pheomelanin is responsible for red hair, or reddish tinge to blonde or brown hair. All humans have at least some pheomelanin in their hair, though some individuals have so little that it is not possible to notice with the naked eye. The ratio of eumelanin to pheomelanin in a given individual is of medical interest, as research has shown that the lower the ratio, the higher the individual’s sensitivity to UV-B, the potentially harmful region of the spectrum in sunlight.
#11 Hair Color: Record your individual data and the class data in the Table.
#12 Eye Color: Brown (RR or Rr) Not Brown (rr)
Like hair color, eye color is determined by the deposition of different concentrations of melanin in the various layers of the iris. Once thought to be a result of simple dominance/recessiveness at one or two gene loci, eye color is now known to be far more complicated than that.
It is a polygenic trait influenced by possibly a dozen different genes. Some of these encode pigment production, others the transport of those pigments, and still others the exact location and concentration of deposition. At least three gene loci involved in the development of human eye color have been identified. EYCL1, located on chromosome 19, is involved in the coloration of green/blue eyes, EYCL2 in brown eyes, and EYCL3 in brown/blue eye coloration. The action of these genes is, in turn, affected by numerous other gene products encoded at other loci.
The most common eye color in humans is brown, which should be considered the wild type for our species. Lighter variants are produced by lower concentrations of melanin in the iris tissues, with blue eyes indicating little, if any melanin present. The blue color is due to refraction of light by the iris tissues themselves, and is not a pigment. Different concentrations of melanin in the iris will change the light-colored blue iris to green, hazel, grey, etc. Eye color is so complex that it is now considered nearly impossible to predict the eye color of a child simply by examining the eye color of its parents. So if you’re a brown-eyed child with light-eyed parents, you can relax.
#12 Eye Color: Record your individual data and the class data in the Table.
Count up the number of times the class followed the expected frequency ratios and express that as a ratio out of the total number of traits examined.
What is the least likely problem(s) with the class data that would explain the discrepancy between the expected ratios and the actual ratios calculated by the class' data? Select any answers that you believe do not account for the discrepancy.
Punnett Square Practice with your genetic traits
1. Monohybrid Cross: Recessive x Recessive
Select one of the human traits (#1-12) that was recessive and use that for the alleles in the punnett square cross. Label punnett squares appropriately and use the allele given for that trait.
The genotypic and phentopic ratios for this recessive cross are the same: 0:4
Punnett Square Practice with your genetic traits
2. Monohybrid Cross: Heterozygous x Heterozygous
Select one of the human traits (#1-12) that was dominant and use that for the heterozygous alleles for the trait in the punnett square cross. Label punnett squares appropriately and use the allele given for that trait.
The genotypic ratio for the heterozygous cross is
The phenotypic ratio for the heterozygous cross is
Punnett Square Practice with your genetic traits
3. Dihybrid Cross: Heterozygous vs Heterozygous
Select two of the human traits (#1-12) that were dominant and use their heterozygous alleles in an imaginery punnett square cross. Select the statement that isn't true about the alleles in this cross.
You do not have to do the actual cross, however, you should be able to recognize the genotypic and phenotypic information in such a cross as shown in your textbook and ppt slides on dihybrid crosses. Find the statement that is incorrect regarding a dihybrid cross.