Boiling & Melting Point HW
star
star
star
star
star
Last updated almost 8 years ago
6 Nsɛmmisa
Hyɛ no nsow a efi ɔkyerɛwfo no hɔ:
boiling point & melting point HW
1
1
1
1
1
1
boiling point & melting point HW
The graph below represents the heating curve of a substance that starts as a solid below its freezing point.
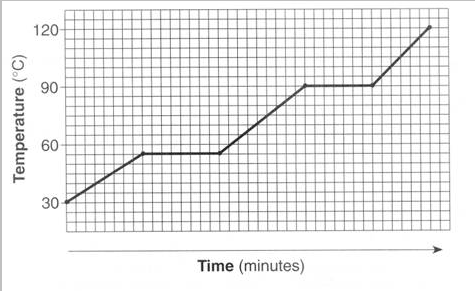
What is the melting point of this substance?
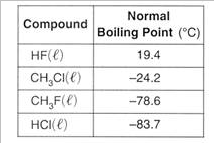
Substances with higher boiling points and higher melting points have more attractive forces between their molecules. The more attraction there is between the molecules, the more energy is needed to pull the molecules apart from one another to get the molecule to change phase. In the below chart, which one has the strongest, most attractive forces between the molecules?
What is happening to the average KINETIC (moving) energy of the particles in segment BC of this graph?
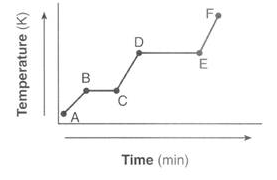
Identify the process that takes place during line segment DE of the heating curve.
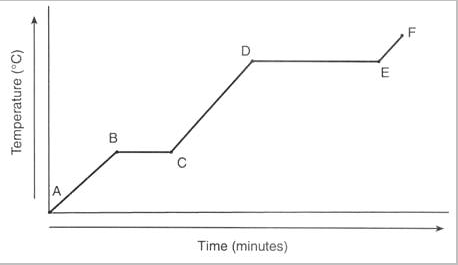
Given the heating curve where substance X starts as a solid below its melting point and is heated uniformly:

Identify where the average kinetic energy is increasing in our graph.
How would the particles appear at point F in this graph?
