AP Physics C Air Resistance Quiz
star
star
star
star
star
Last updated over 8 years ago
19 Nsɛmmisa
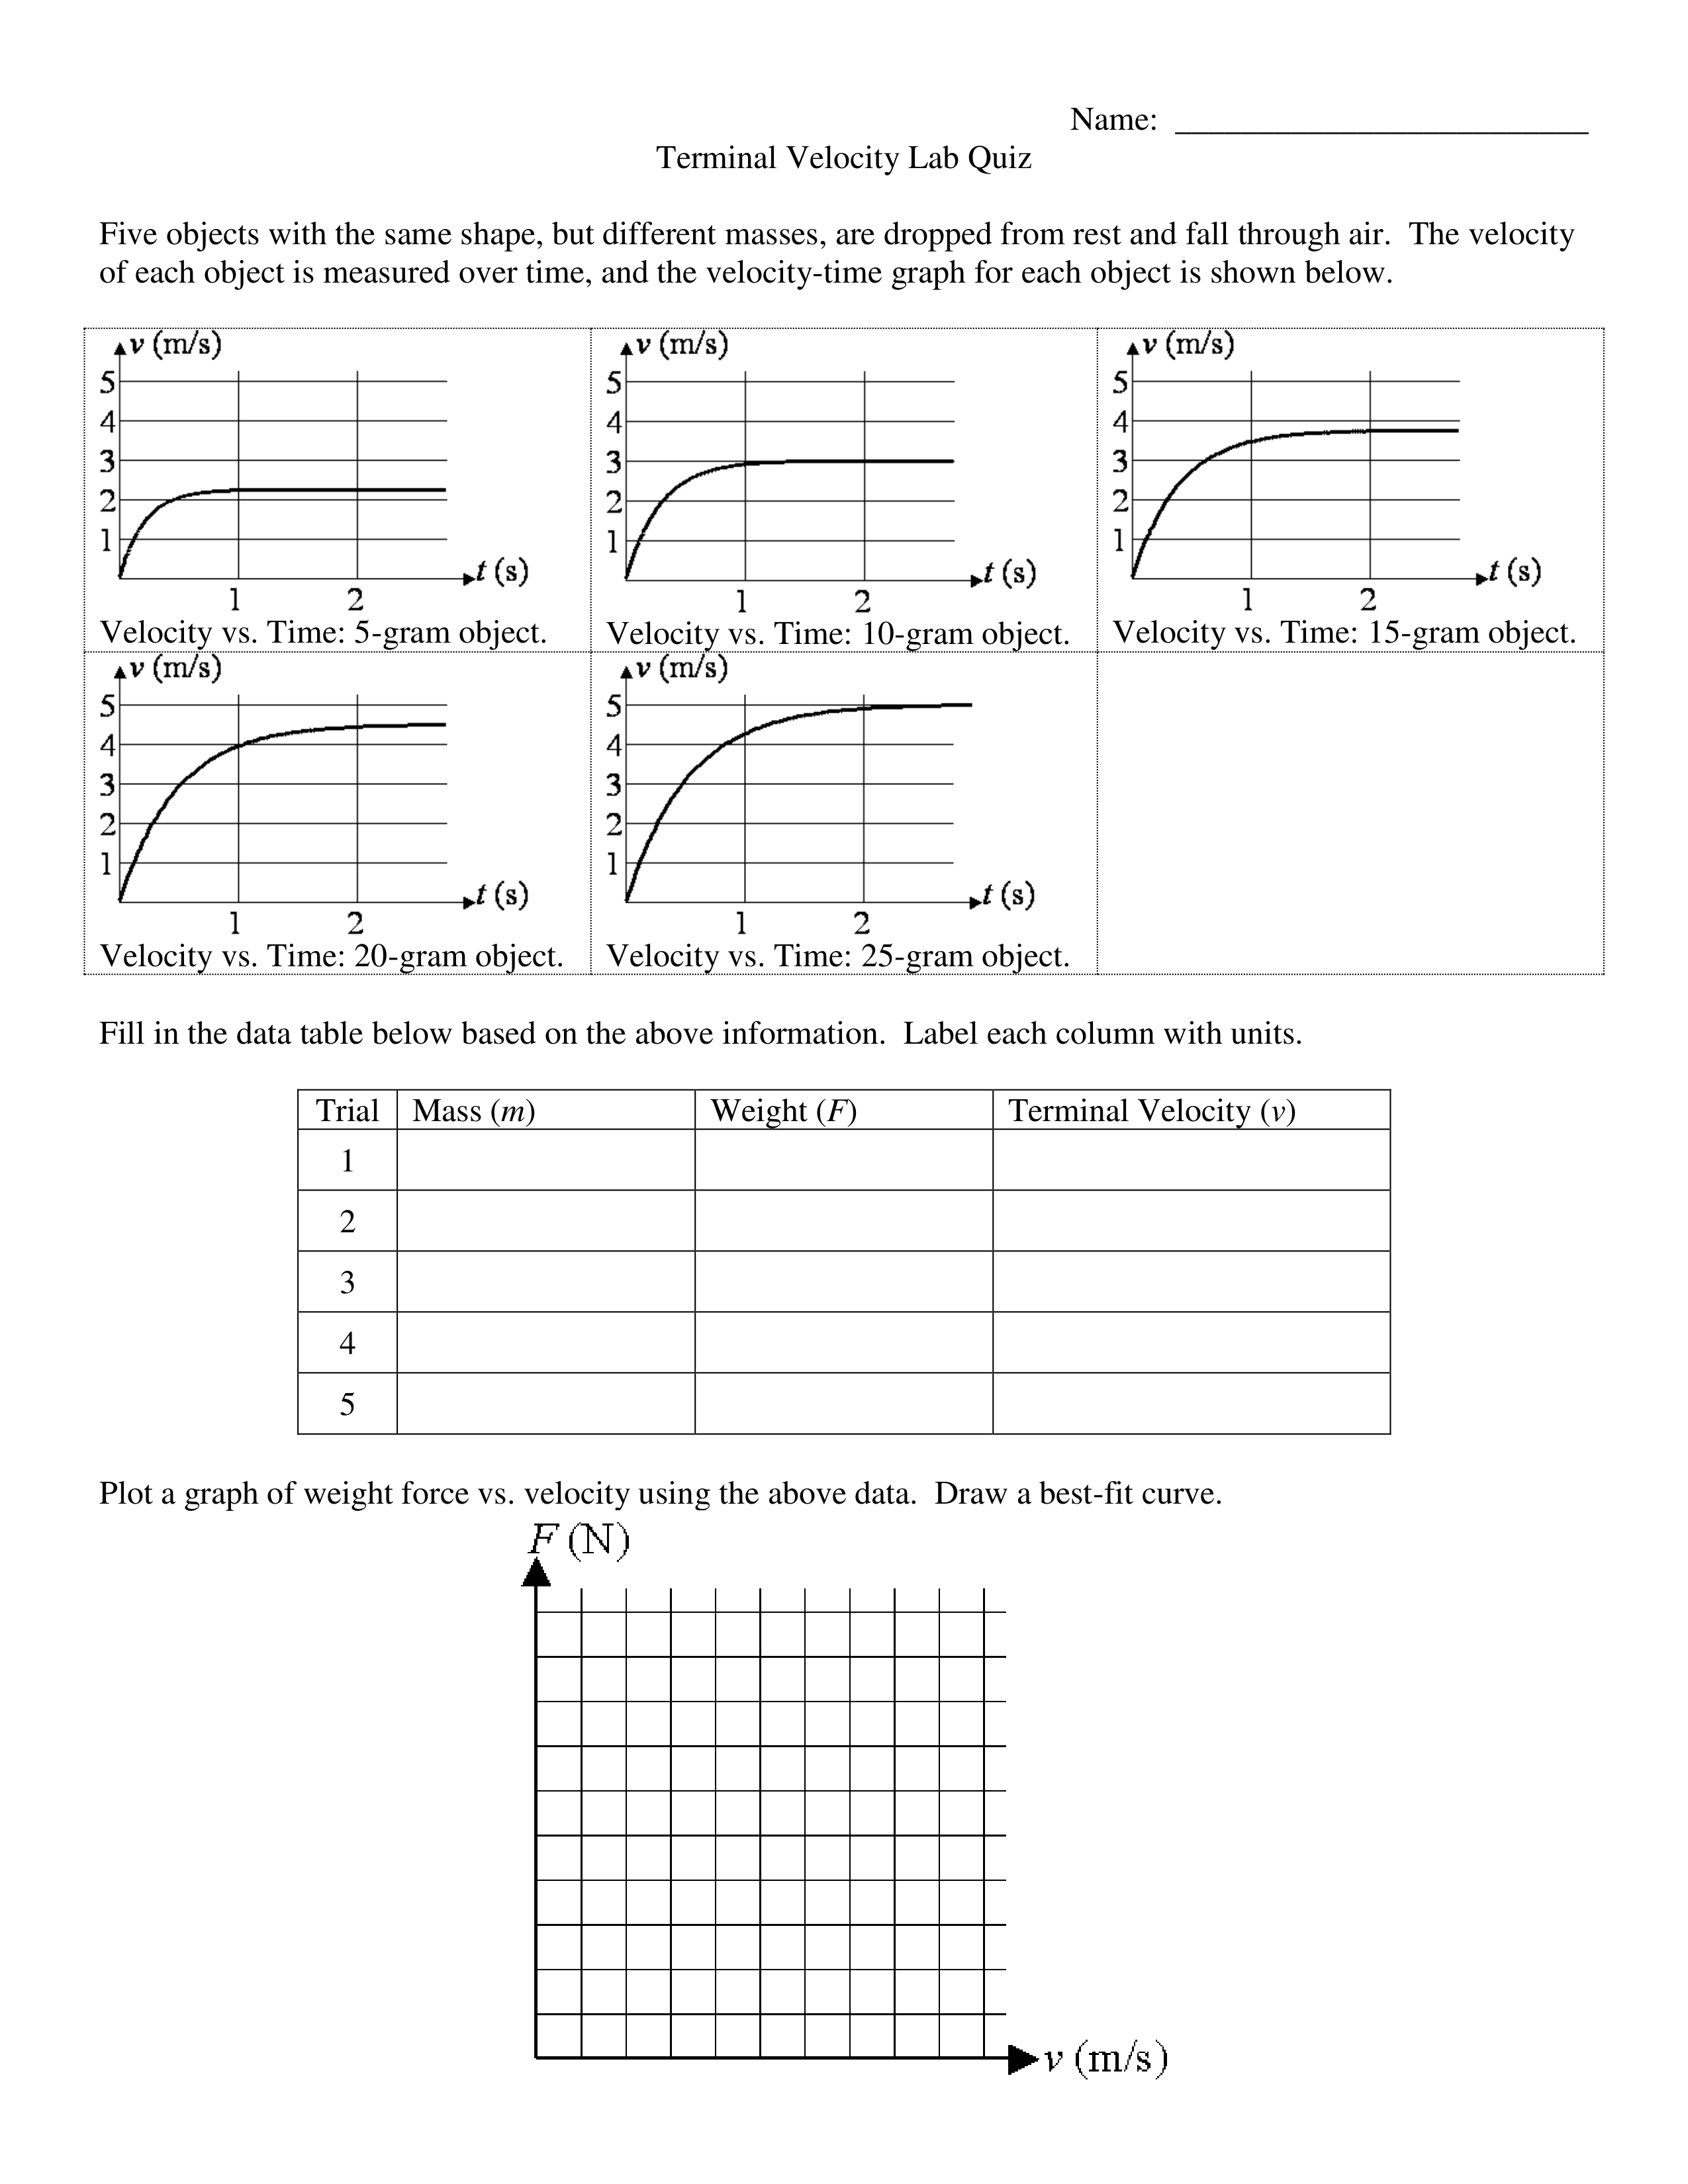
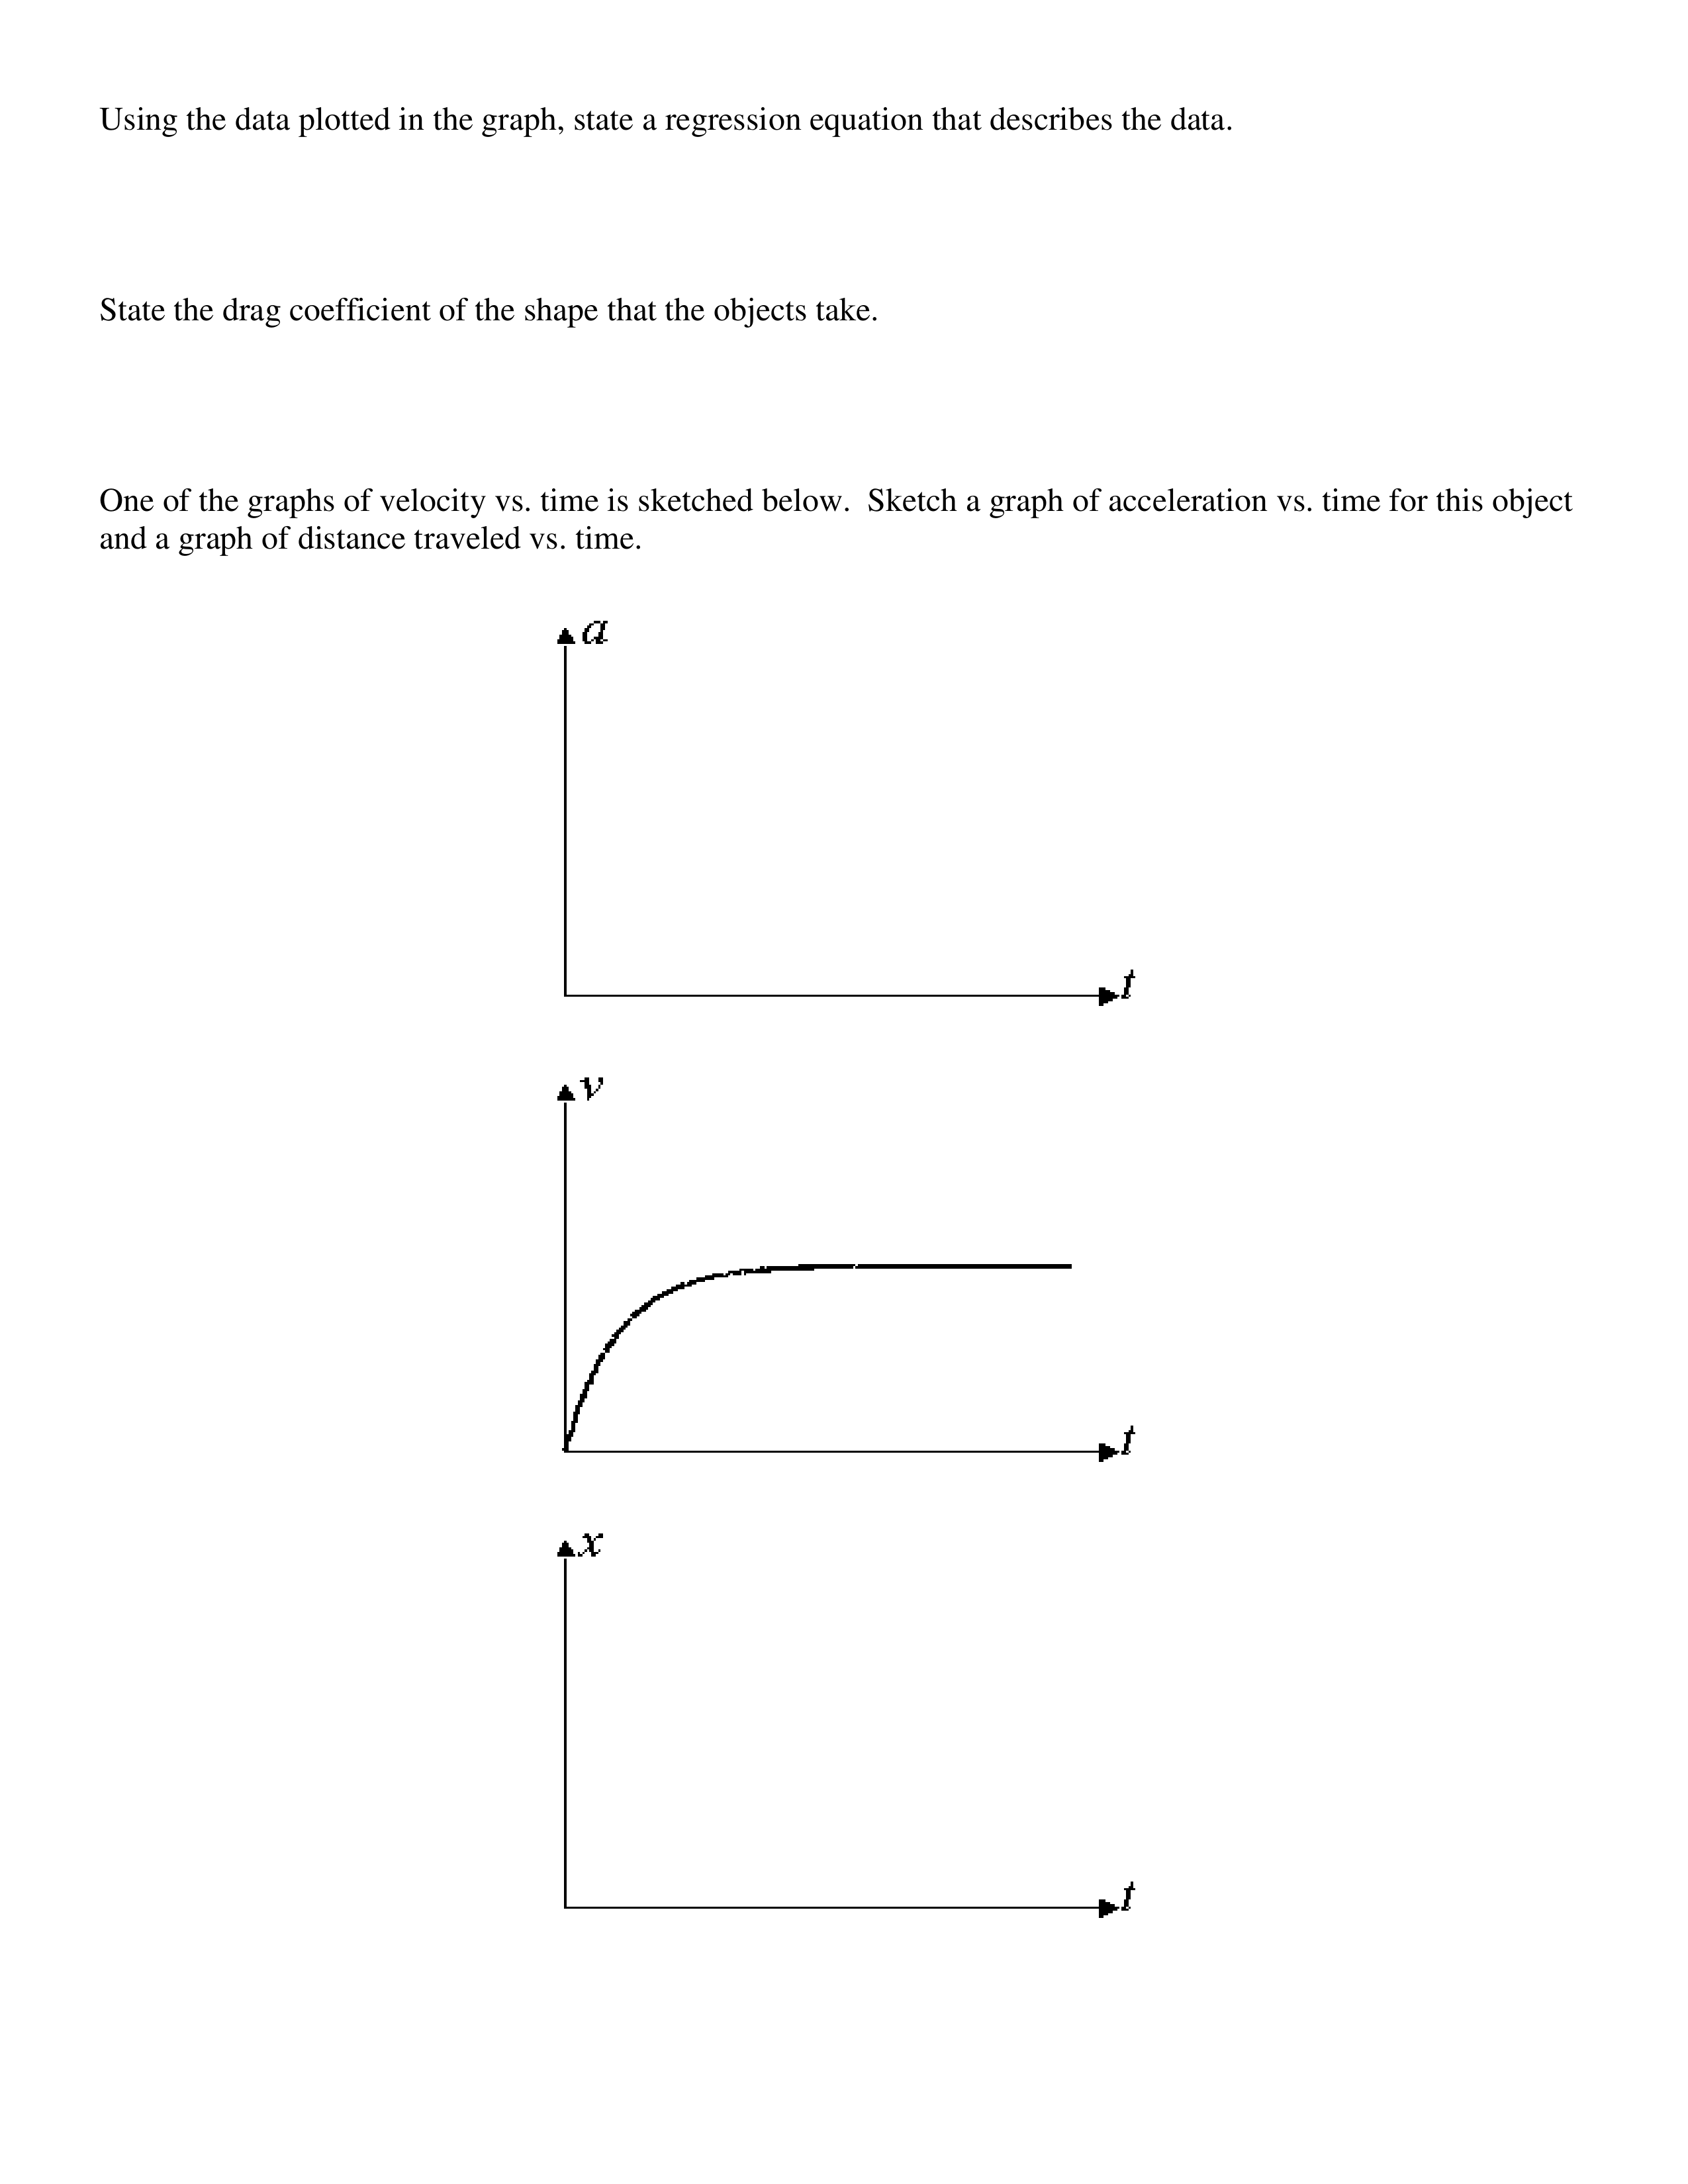
Using the data plotted in the graph, state a regression equation that describes the data.
Plot a graph of weight force vs. velocity using the above data. Draw a best-fit curve.