Analyze This Concept Check Honors
star
star
star
star
star
Posljednje ažuriranje over 6 years ago
10
1
1
1
1
1
1
1
1
1
1
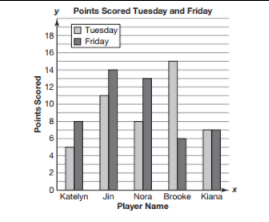
What is the difference between the two days for Brooke? Write the number.
How many girls play the trumpet?

How many total boys are in the band?
What is the distribution of this histogram?

What is the distribution of the line plot?

tion of the graph?
What are the cluster(s) for the graph?

What are the gap(s) for the dot plot?

What is the relative frequency for mark 4, mark 5, and mark 9?

Mabel surveyed 55 people to find out their favorite types of music. The results are shown in the bar graph.

Based on the information in the graph, which types of music were chosen by 40% of the people surveyed?
The graph shows the favorite colors chosen by some middle school students.

Which statement is supported by the information in the graph?